
Employment gains, productivity strains: Sectoral shifts and new geography of growth in the euro area

Abstract
Over the past five years, euro area growth has has been marked by persistent headwinds, with average growth falling short of the 2016-2019 period. This muted growth dynamic calls for the need to examine country-level sectoral drivers to better understand the evolution of the region’s potential growth.
Our findings point to growth being increasingly reliant on employment gains, amid a pronounced slowdown in labour productivity – primarily within the industry sector. Since 2015, this decoupling between employment and labour productivity has become more evident, with employment gains concentrated in traditional sectors and unlikely to drive future productivity gains.
The geography of growth has also shifted. Germany and France, once the engines of euro area growth, have lately seen more subdued economic performance. In contrast, countries sometimes referred to as the periphery – including Ireland, Cyprus, Portugal, Greece and Spain – have outperformed. This reversal between core and periphery is multifaceted, reflecting stronger labour market dynamics in the periphery, multinationals-driven growth in Ireland, a significant productivity decline in France, and subdued employment in Germany.
Looking ahead, the euro area’s growth prospects remain precarious. Adverse demographic trends are expected to significantly constrain employment growth. Without a broad-based recovery in labour productivity, potential growth could fall to just 0.5% by 2029 – well below current forecasts. These trends highlight the urgent need for coordinated policy action to support productivity-enhancing reforms and secure sustainable long-term growth.
Acknowledgements: The authors would like to thank Rolf Strauch and Giovanni Callegari for advice and guidance, and Karol Siskind for editorial support.
The euro area’s post-pandemic recovery: A fragile recovery
The euro area’s post-pandemic recovery has fallen short of expectations, with real GDP growth remaining well below pre-pandemic trends. Between 2020 and 2023, average annual growth lagged almost 1 percentage point (pp) behind the 2016-19 period, while the growth gap with the US doubled from 0.6 to 1.2 pp (Figure 1). Beneath the aggregate figures lies substantial cross-country heterogeneity: former growth engines like Germany have experienced the largest decline, while traditionally weaker performers like Italy and Greece show modest gains. Rather than signalling convergence, this shift reflects a broader weakening in the region’s growth dynamics: a race to the bottom rather than alignment to the top.
What explains the euro area’s sluggish recovery and growing cross-country heterogeneity? The economic repercussions of the war in Ukraine – marked by energy price shocks, supply chain disruptions and broader uncertainty – have certainly played a role. But is the euro area’s weak growth merely a consequence of external shocks? Or have recent shocks and the uneven impact across countries just exposed deeper productivity problems in the euro area? Understanding the root causes of the region’s sluggish recovery is essential to assessing whether growth can regain momentum – or whether it is facing a more fundamental and prolonged decline.
Figure 1: EA: Average annual real GDP growth and country contributions (% and pps)
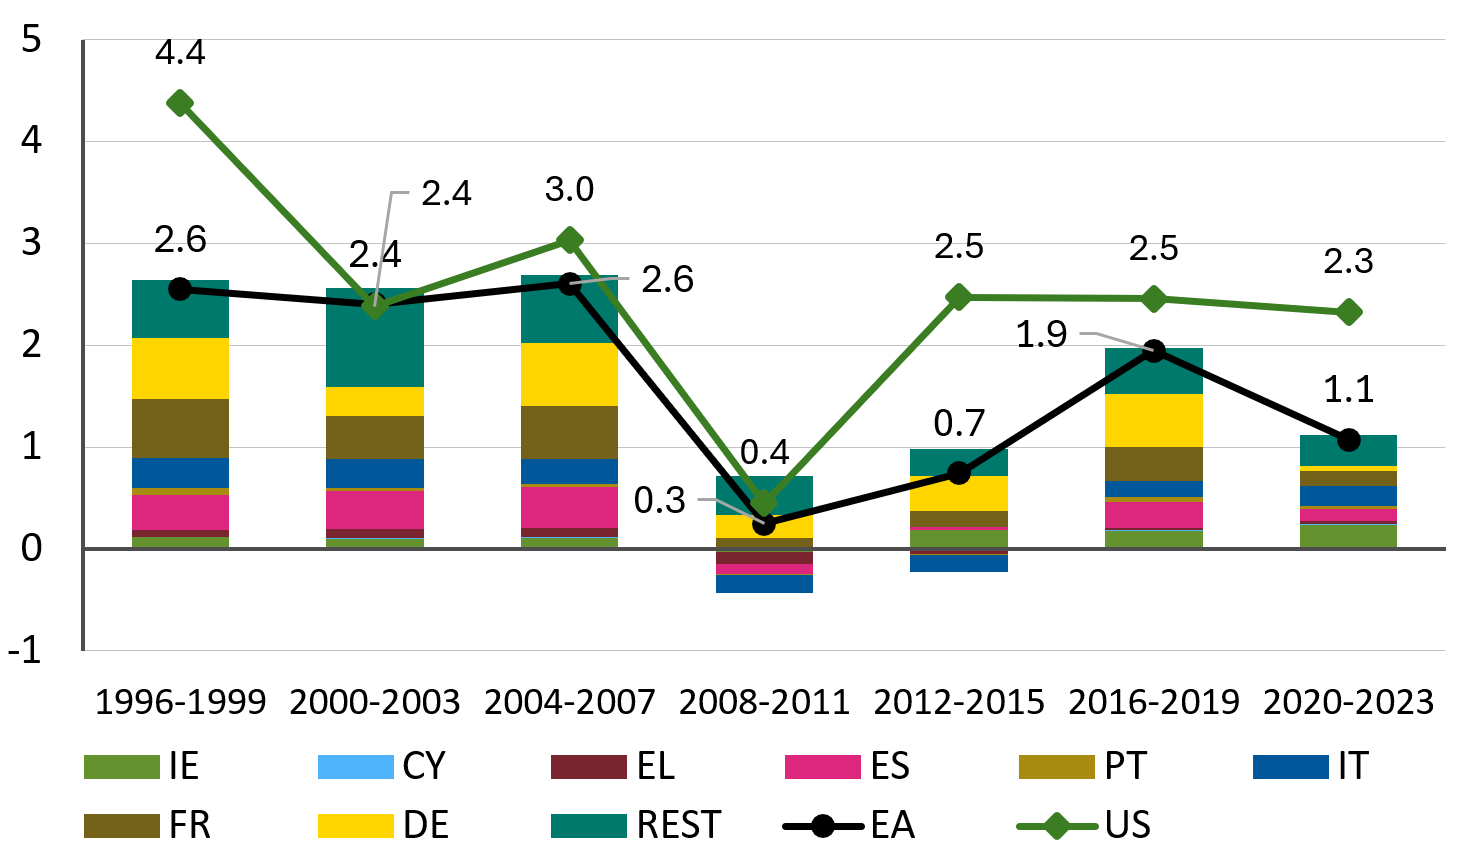
Source: Eurostat, Haver, and ESM calculations
Figure 2: Difference in annual average real GDP growth between 2016-19 and 2020-23 (pps)
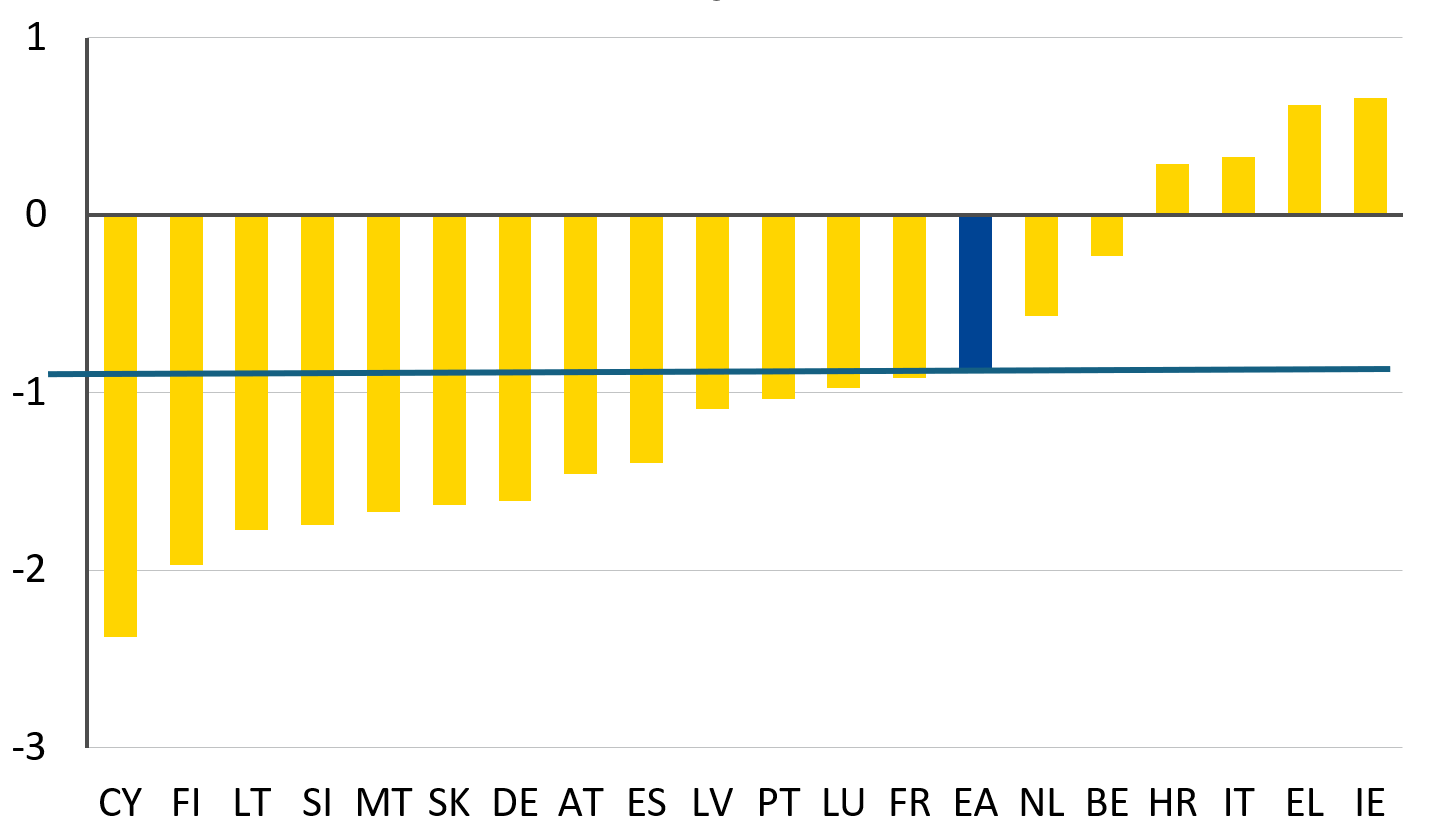
Source: Eurostat, Haver, and ESM calculations
To shed light on these questions, we examine the production side of the euro area economies, focusing on labour productivity and employment trends across sectors. Examining the sectoral distribution of productivity growth allows for a more granular identification of where slowdowns have occurred. Sector-specific slowdowns may indicate idiosyncratic causes requiring targeted solutions, whereas broad-based slowdowns may instead point to systemic or macroeconomic factors. We adopt a sectoral decomposition framework (Nodari et al, 2022), which breaks down potential growth[1] into the contributions of labour productivity and employment at sector level.[2] For each country, we assume that sectoral labour productivity and employment growth are driven by two factors: one common across the euro area (sectoral norm), and a country-specific one, that defines whether the sector over- or underperforms the common sectoral norm, thus creating a sectoral gap.[3 ] We also account for labour reallocation across sectors as a potential source of aggregate labour productivity gains.
In what follows, we present the results of our empirical analysis and discuss policy implications for enhancing the euro area’s long-term growth resilience.
A shifting paradigm: Falling productivity amid rising employment
We begin by examining aggregate labour productivity and employment trends based on sectoral norms – sectoral trends that are common across euro area countries. These norms are derived under the assumption that each sector within the euro area should grow at the same rate regardless of the country in which it is located.[4] By aggregating these sectoral norms, we construct a benchmark for the euro area’s underlying productivity and employment dynamics.
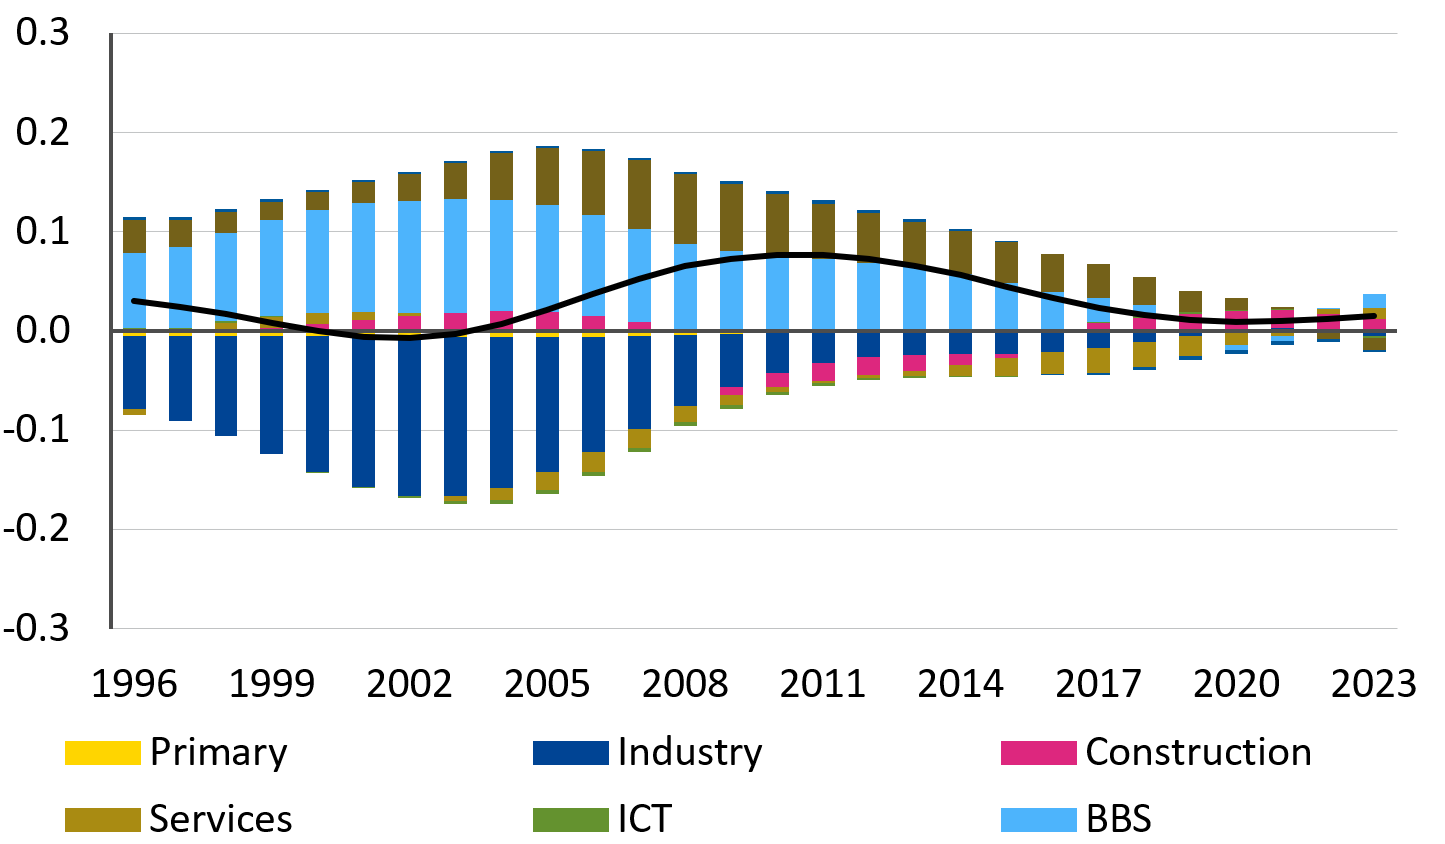
The analysis reveals a persistent decline in labour productivity growth at euro area level, with the slowdown becoming more pronounced over the past decade (Figure 3). While the common component of labour productivity growth averaged around 0.5 pp until 2015, it has since fallen to a mere 0.1 pp, indicating a significant erosion in production efficiency. In the face of slowing labour productivity, employment growth has become the dominant driver of aggregate output (Figure 4). Since the trough of the global financial crisis, employment growth has accelerated steadily, recently exceeding 1 pp annually.
The industrial decline behind Europe's productivity slowdown
A closer look at the sectoral contributions reveals that the labour productivity decline is almost entirely driven by the weakening performance of just one sector: industry (Figure 3). In the 2000s, industry was the primary engine of labour productivity growth in the euro area, contributing approximately 0.6 pp per year. Following a broader deindustrialisation trend seen across advanced economies, the sector has seen strong outlays of employment.[5] Nevertheless, it continued recording productivity gains, while part of the workforce moved to other sectors, especially business and non-market services. This can be seen in Figure 5, which presents the effects of the relocation of workers across sectors with varying productivity levels. The inflow of labour into these sectors likely exerted downward pressure on their respective labour productivity over the same period. However, since 2014, this dynamic has changed. Employment in industry has stabilised, but productivity growth has steadily declined until disappearing recently. Meanwhile, labour productivity growth in other sectors has remained relatively stable. Traditional services and Information and Communication Technology (ICT) have experienced marginal declines, while business services have shifted from being a drag on labour productivity growth to becoming marginally positive contributors. Despite these sectoral shifts, they have proven insufficient to counterbalance the steep decline in industrial labour productivity.
Figure 3: Labour productivity norm decomposition (% growth)
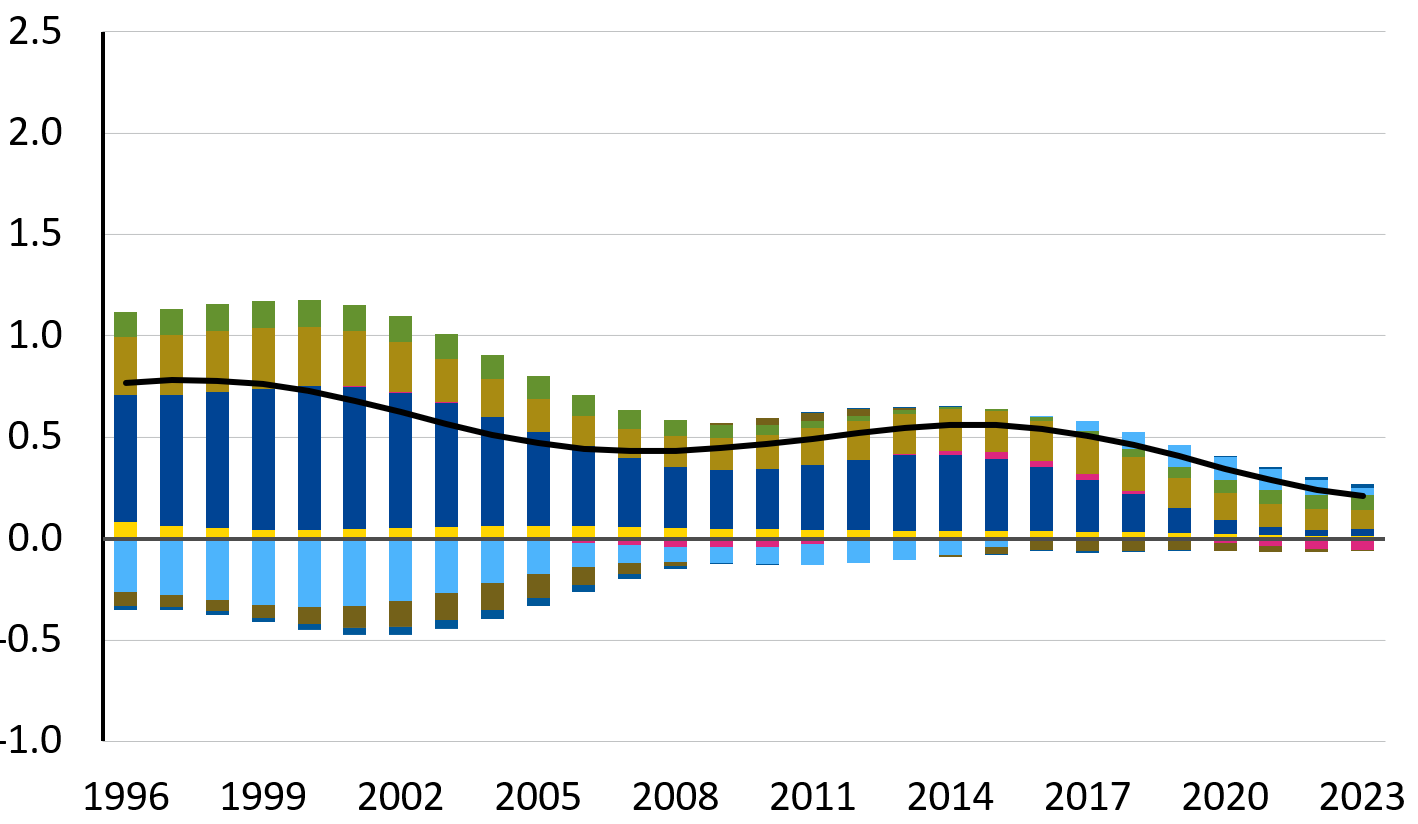
Figure 4: Employment norm decomposition (% growth)
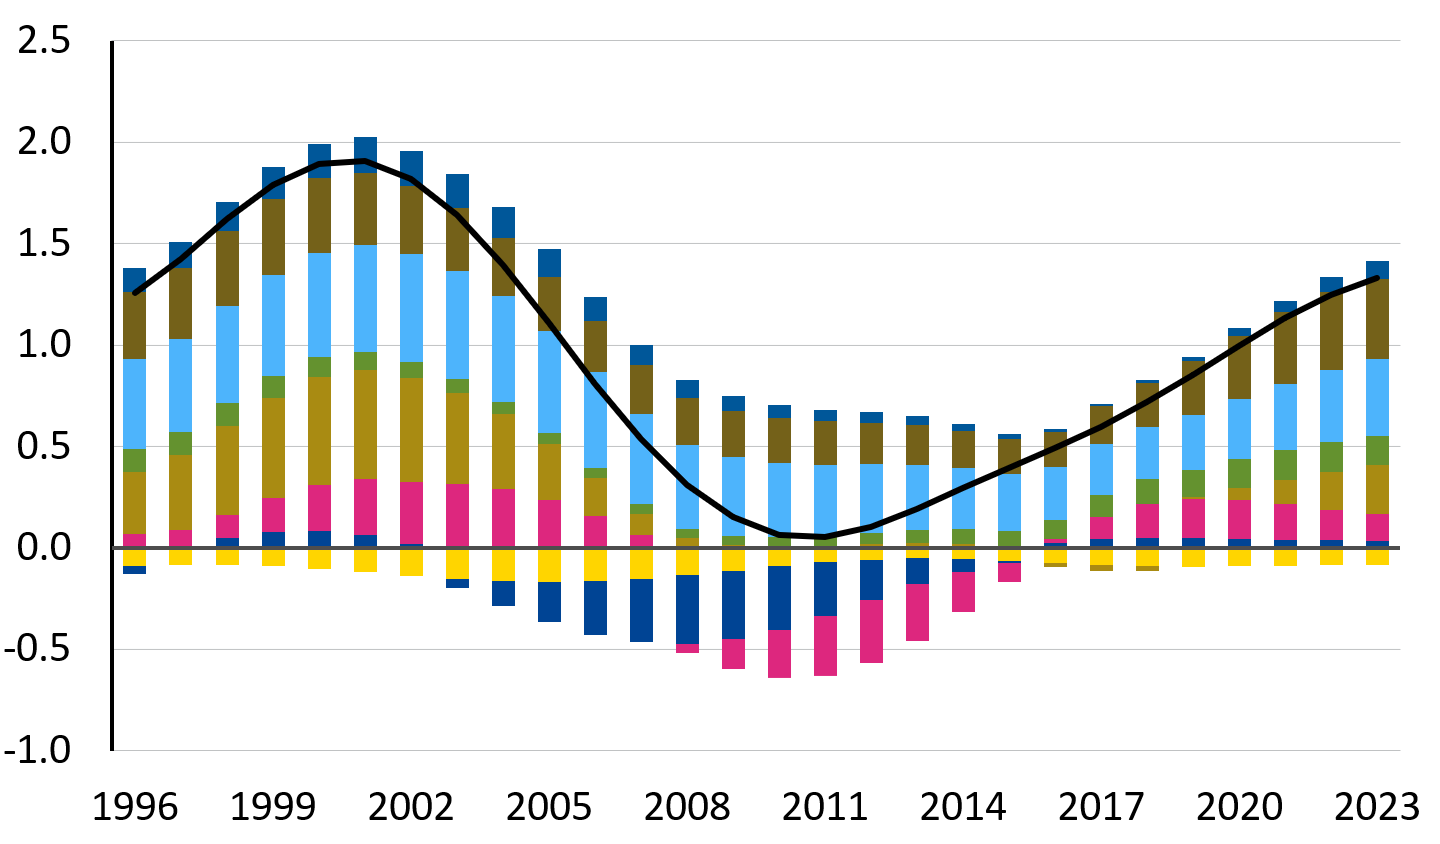
Source: ESM calculations based on empirical model. Note: Services reflect the NACE group G-I sectors, ICT stands for Information and Communication sector, BBS stands for Broad Business Services sectors and groups NACE K-N sectors.
Is the rise in euro area employment a prelude to productivity gains?
A potential interpretation of the employment surge could be that firms have been hiring in anticipation of future productivity improvements. However, our sectoral decomposition of employment growth suggests that this is unlikely to be the case. Since 2015, roughly two thirds of the increase in employment has been concentrated in low-productivity sectors, split between non-market sectors (mostly public administration) and the cyclical sectors of construction and services (such as retail and hospitality). The remaining share has gone to business services, and to a lesser extent ICT. While artificial intelligence has the potential to improve productivity in business services and ICT, employment shifts to business services seem a continuation of pre-existing trends, which saw the sector growing as a share of total gross value added (GVA), rather than the prelude of a structural break in productivity.
Figure 5: EA: Sectoral decomposition of the reallocation effect in the EA (% growth)
Source: Eurostat, Haver, and ESM calculations
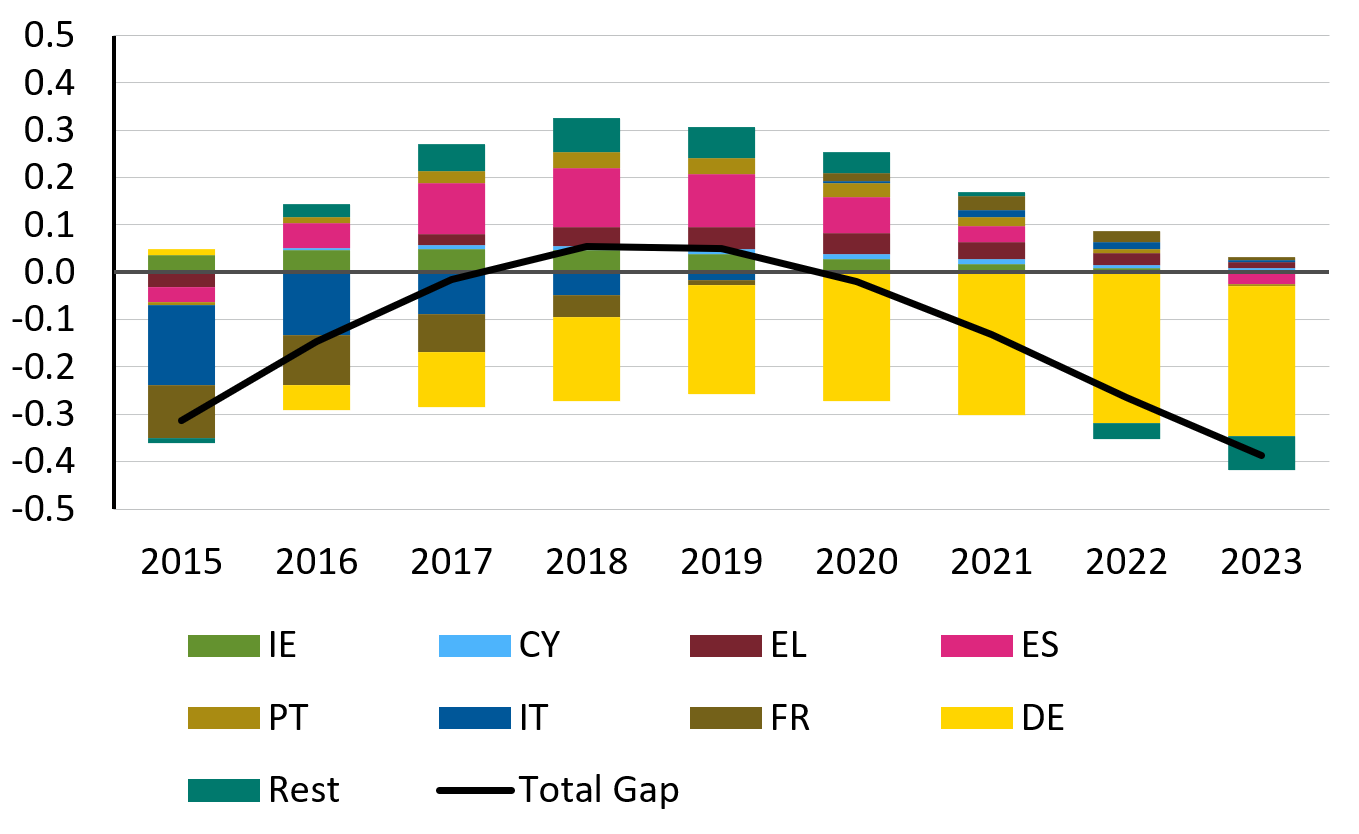
Figure 6: EA total gap, country decomposition (% growth)
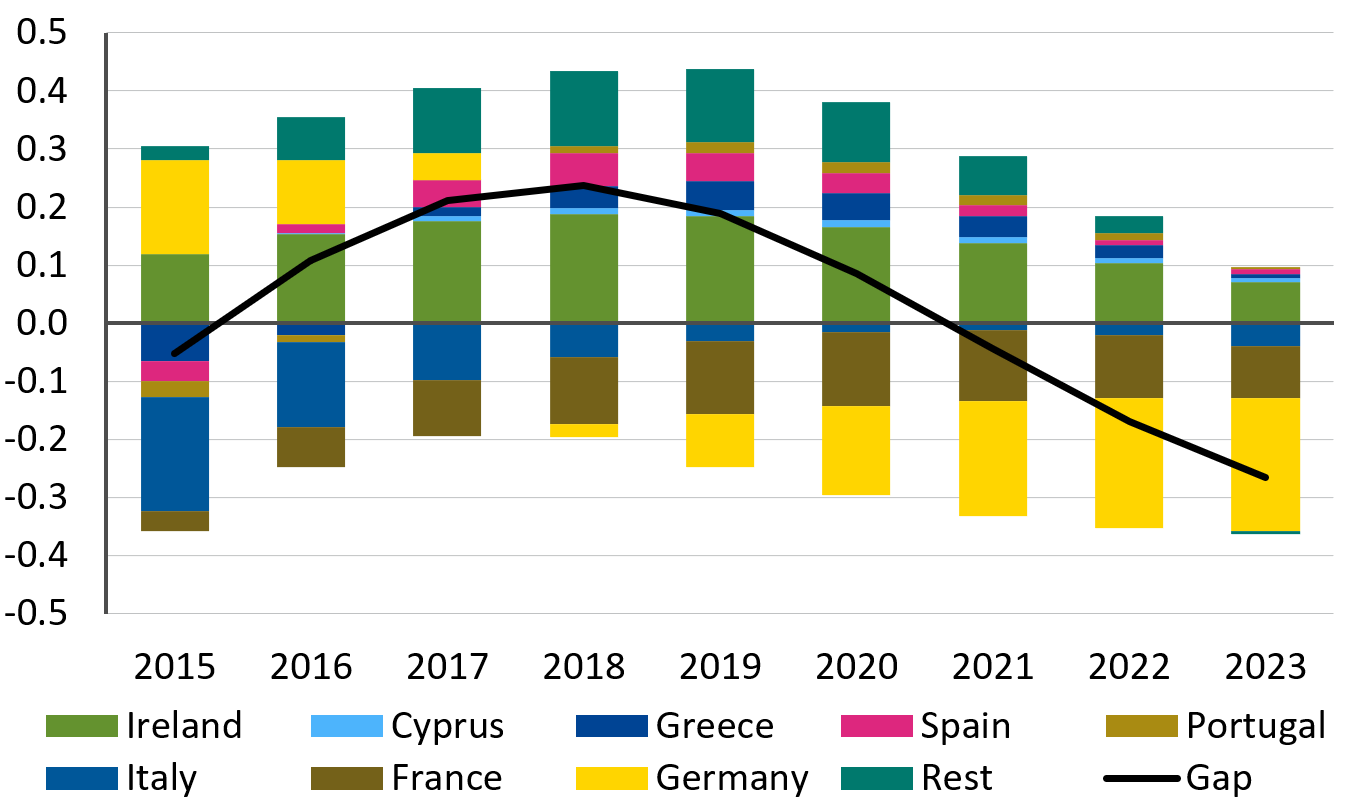
Source: Eurostat, Haver, and ESM calculations
Country-level dynamics and the shifting geography of growth
Building upon the analysis of common sectoral trends in labour productivity and employment (sectoral norms), we now analyse how these sectors performed at country level. For this, we look at country-specific sectoral deviations from common euro area trends, referred to as sectoral gaps. Positive (negative) values represent over-(under-) performance at the country level. Because the aggregation of these gaps does not sum to zero,[6] their distribution – particularly among larger countries – matters for the aggregate and could drag euro area figures up or down.
The findings reveal a pronounced divergence among member states. From 2015 to 2023, larger economies such as Germany and France transitioned from positive to increasingly negative gaps, collectively exerting a drag on euro area growth by almost 0.4 pp (Figure 6). In contrast, several other economies – including Ireland, Cyprus, Portugal, Greece and Spain – have posted positive gaps over the same period, steering euro area growth up. Among these countries, Ireland stands out. Despite its small size, sustained productivity gains in high-value-added sectors have had a significant aggregate impact. However, the recent decline in contribution from these smaller countries suggests a potential deceleration in this positive momentum.
But what accounts for this reversal in fortunes between core and the periphery of the euro area? The recent strong performance of peripheral countries, particularly Ireland, Cyprus, Portugal, Greece and Spain - the European Stability Mechanism (ESM) beneficiary Member States - could reflect reforms and post-crisis catch-up dynamics. During the sovereign debt crisis, these countries suffered from high unemployment and partial capital underutilisation, that would allow them to grow quickly, once economic conditions improved. If this is the story, their strong performance would be explained predominantly by employment. Alternatively, overperformance due to productivity gains could indicate structural improvements pointing towards more sustainable growth and increased resilience.
Reversal of fortunes: The euro area’s periphery outpaces core economies – where and why?
Our analysis reveals distinct patterns behind the periphery’s overperformance. In the South, growth has been primarily driven by employment, largely due to expansion in the services sector. In contrast, Ireland’s gains have been predominantly led by productivity, underpinned by strong performance in ICT and industrial sectors.
In Portugal, Spain, and Greece, the overperformance has been largely employment-driven, consistent with an improvement in labour market condition (Figures 7 and 8), while labour productivity has remained in line with the euro area norm. Services were the main contributor – a labour-intensive sector (Figure 9). Industry also made a significant contribution in Greece, while construction played a key role in Portugal, pointing to a relatively broader sectoral base for employment gains.
Productivity gains seem to be a significant driver of overperformance only in Ireland, and to a lesser extent Cyprus. In Ireland, strong contributions from ICT and industry fuelled strong productivity (Figure 10), building on its position in high-value-added activities and its role as a hub for multinational companies. Cyprus displayed a more mixed sectoral picture, with contributions from both services and ICT.
Italy presents a unique case: growth seems mostly driven by the construction sector, and to a lesser extent traditional services, while labour productivity in business services and industry have weakened significantly.
Our analysis highlights diverging drivers of underperformance in core countries: labour productivity in France, and employment in Germany. In France, broad-based weak performance across most sectors aligns with weak labour productivity. However, Germany presents a more complex picture: while labour productivity growth has remained relatively strong and above the euro area average, recent employment losses have more than offset these gains. At sectoral level, Germany underperforms across the board, though productivity remains solid in industry and business services, with weaknesses concentrated in traditional sectors, such as construction.
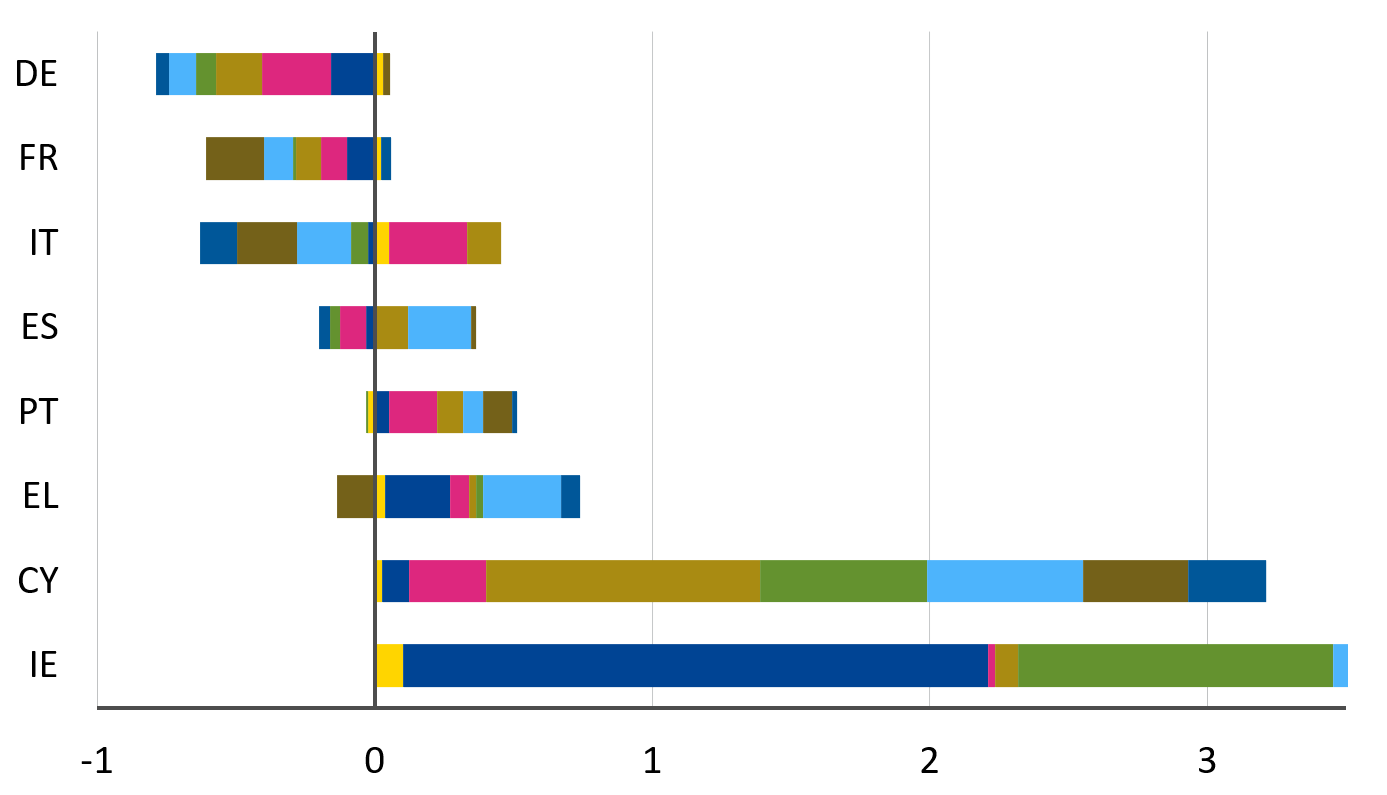
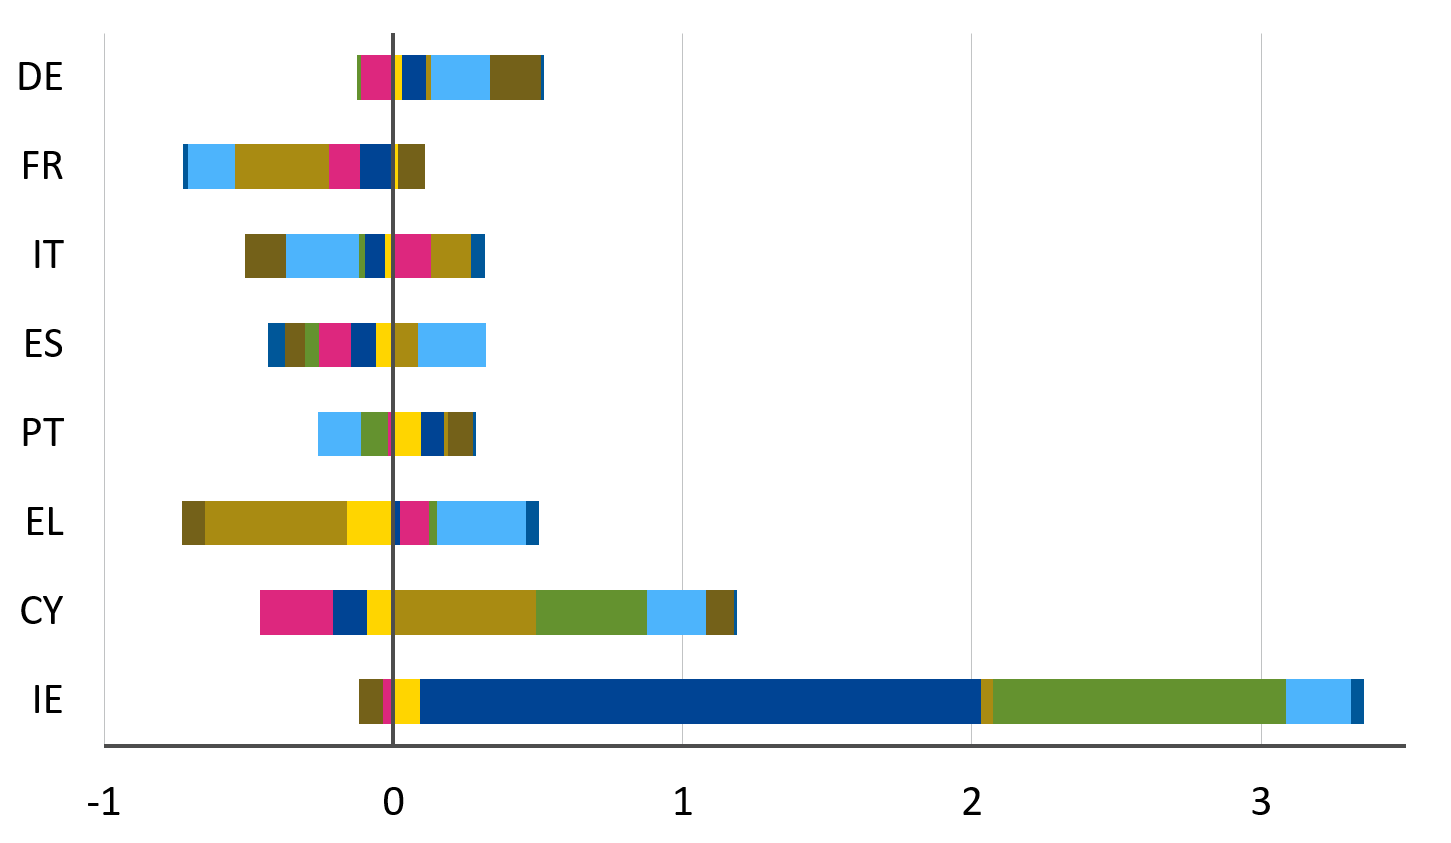
Figure 7: Labour productivity gap decomposition (% growth)
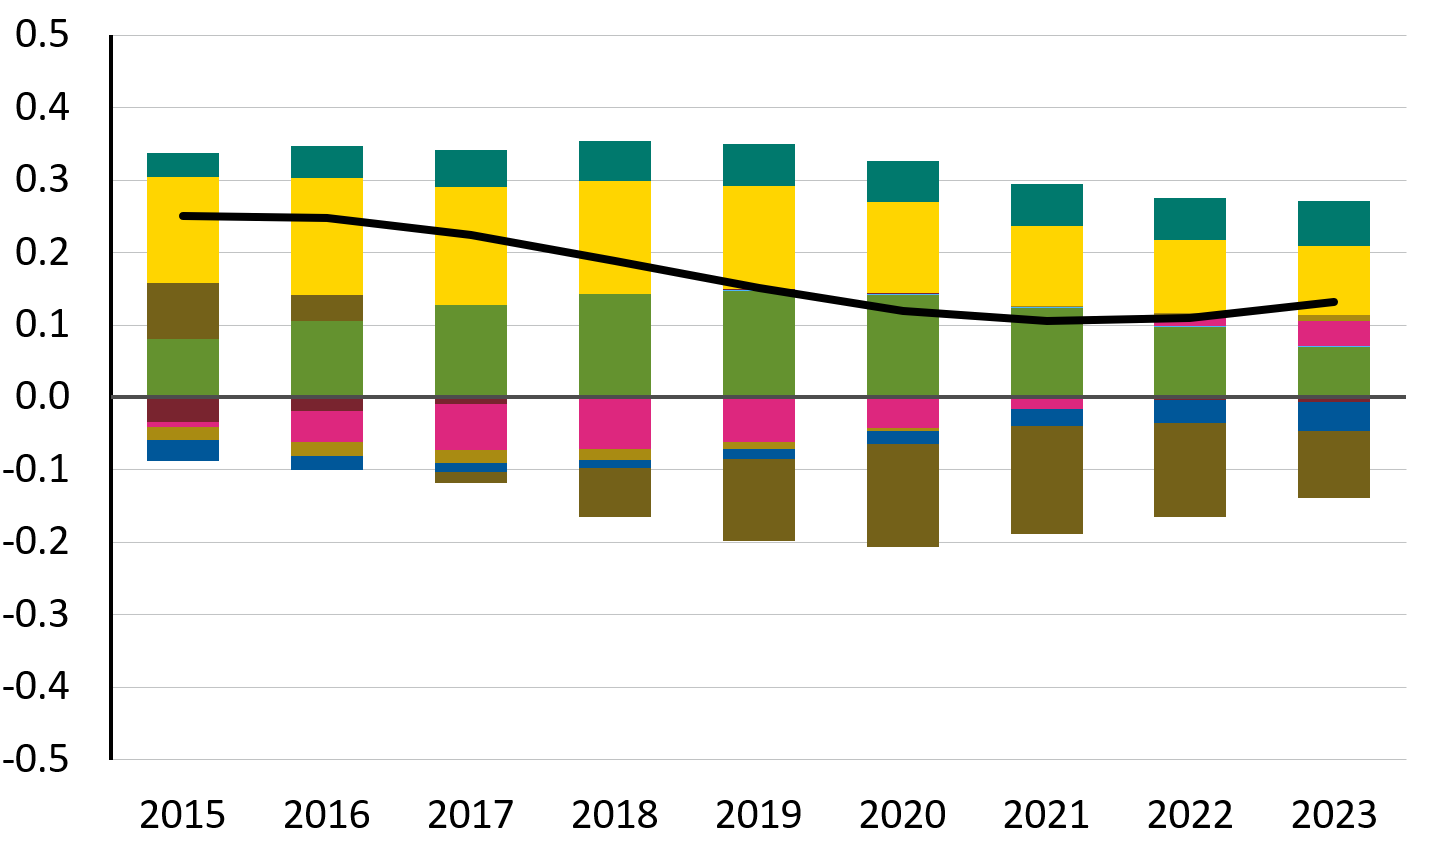
Source: Eurostat, Haver, and ESM calculations
Figure 8: Employment gap decomposition (% growth)
Source: Eurostat, Haver, and ESM calculations
Figure 9: Sectoral decomposition of total gap at country level (% growth, 2019-2023 average)
Source: Eurostat, Haver, and ESM calculations
Figure 10: Sectoral decomposition of labour productivity gap (% growth, 2019-2023 average)
Source: Eurostat, Haver, and ESM calculations
Taken together, these findings underscore two distinct patterns: (i) larger economies, particularly Germany and France, have lately underperformed across key sectors, dragging down aggregate euro area growth, and (ii) the recent overperformance of smaller countries – while notable – is mostly concentrated in services and may be starting to reverse. Clusters of productivity gains in ICT and industry are particularly strong in Ireland and Cyprus, largely reflecting the activities of multinationals (mostly from the US in the case of Ireland). However, Germany also continues to register labour productivity gains in industry and business services, suggesting that sectoral strengths remain, even if weighed down by weaker employment dynamics.
Implications for medium-term growth
From an aggregate point of view, we find that employment gains have so far offset productivity losses, resulting in a relatively stable euro area potential growth of around 1.3 pp over the last five years.[7] This, however, is unlikely to be sustainable as unfavourable demographic trends are expected to significantly constrain labour market growth in the coming years. As a result, the future trajectory of euro area growth will depend critically on the ability to revive labour productivity growth.
To assess the outlook of euro area trend growth over the next five years, we provide an indicative calculation using the European Commission’s (EC) T+5 estimates of employment growth as an input. First, we assume that employment evolves in line with the EC projections, while labour productivity growth remains constant at our current estimates. Then, we consider a potential rebound in labour productivity[8] as employment growth slows, based on the historical inverse relationship between the two.
The results point to a significant downside risk to the EC’s growth outlook. With demographic trends constraining labour market growth, the region’s potential growth could fall sharply—from the current 1.3% to just 0.5% by 2029 (Figure 11).[9] This would represent a significant shortfall compared to the EC’s estimate of 1.0%. Even when considering a potential rebound in labour productivity as employment growth decreases, the gap remains substantial. Achieving the EC projections will require policy measures and targeted investments to successfully boost labour productivity across the region.
Figure 11: Scenario in the EA (% growth)
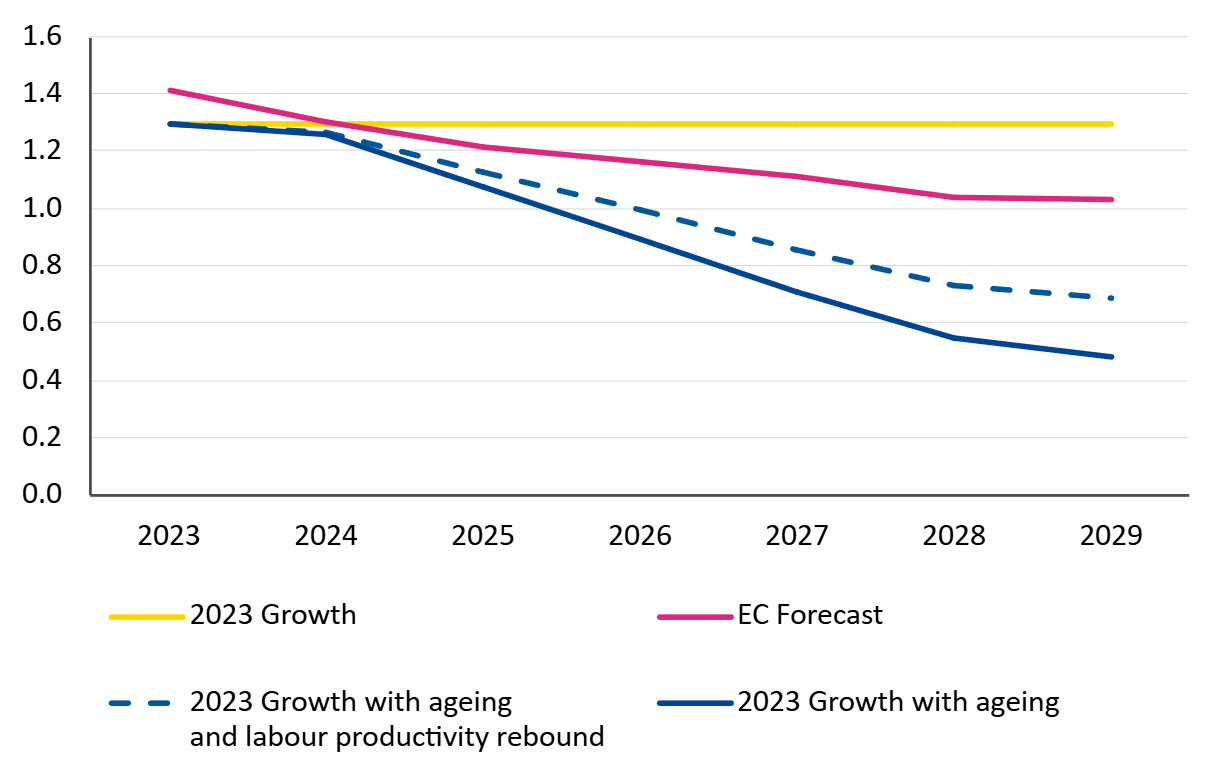
Note: The labour productivity rebound reflects the inverse relationship between labour productivity and employment growth, with a negative correlation of approximately -0.25. The rebound emerges due to the sharp adjustment in employment projections, driven by the EC’s employment assumption accounting for the effects of the ageing population.
Source: European Commission (based on 2024 Autumn Forecast) and ESM calculations
Conclusions and policy implications: Sustaining growth in a constrained environment
The euro area’s growth model is at a turning point: over the past decade, employment has increasingly driven growth, while labour productivity has weakened markedly. This dynamic is no longer sustainable. With adverse demographic trends set to constrain labour supply, sustaining economic growth will hinge on reviving labour productivity across sectors and countries. Despite the stability of trend growth in recent years, potential growth could decline significantly in the medium term if labour productivity remains at current levels. This is a material downside risk to the medium-term outlook.
The root causes of the productivity slowdown are both structural and unevenly distributed. Industry – once the key contributor to euro area labour productivity growth – has lost momentum. At the same time, the geography of growth has changed. Former low performers, particularly among the ESM’s beneficiary member states, have registered catch-up gains mostly driven by positive employment dynamics. In contrast, the region’s largest economies – particularly Germany and France – have become a drag on aggregate euro area growth. Without a broad-based turnaround in productivity, growth potential will continue to erode.
These challenges call for a more strategic and coordinated policy response at European level. The Draghi report on European competitiveness highlights a growing recognition that Europe must modernise its growth model. This Brief seeks to highlight the critical urgency of these reforms.
[1] In this analysis, potential growth is defined as the growth rate of the long-term component of GVA, extracted using the Christiano and Fitzgerald (2003) band-pass filter with a periodicity of 11 years. This filter removes short-term fluctuations, isolating the underlying structural growth trend.
[2] As we are interested in low frequency movements in labour productivity and employment, we use a low pass Christiano-Fitzgerald filter, to extract frequencies greater than 10 years.
[3] Employment is measured in terms of worked hours to ensure better comparability across countries and sectors, with labour productivity calculated as real GVA per worked hour.
[4] This is as to assume that all euro area countries share a common technology frontier.
[5] This has caused the sector to grow less than others in relative terms and shrink in size as a share of total GVA.
[6] This is because the norms identify common trends treating each country equally, hence the aggregation does not map into euro area average labour productivity and employment growth. If the norm is mostly driven by the dynamic of smaller countries, the biggest economies will have a larger gap compared to the norm, which will carry a larger weight in the aggregation bringing the aggregate gap up or down.
[7] This is close to the 1.4 pp European Commission’s estimate for 2023 EA potential GDP.
[8] The EC projections as of 2029 show a significant reduction in employment growth compared to the one estimated in our analysis. In the data, a reduction in employment growth by 1% is associated with an increase in labour productivity growth by 0.25%. Accounting for this results in an upward adjustment of our labour productivity estimates as of 2029.
[9] This forward-looking exercise assumes that the euro area GVA trend growth remains constant at its 2023 level (Figure 11, yellow line at 1.3%), with contributions to growth stemming from labour productivity and employment growth norms, reallocation effect, and the LP gap. We recalibrate the implied EA GVA trend growth (Figure 11, blue line) by substituting the employment growth norm from 2023 with the potential total hours growth as projected by the EC – accounting for ageing. This recalibrated growth path is then compared to the EC’s provided potential growth estimates over the forecast horizon (Figure 11, pink line).
Authors


Manager ESM Briefs
