How ESM’s AAA bonds weathered the pandemic storm

While financial markets have begun to focus on the aftermath of Covid-19, even as the pandemic spreads in developing economies, we can look back at 2020 and demonstrate the resilience of ESM and EFSF bond performance during and after the peak of the corona crisis.
When the pandemic hit Europe, the initial market shock was calmed by the positive reaction to the European Central Bank’s €1,850 billion monetary Pandemic Emergency Purchase Programme (PEPP) bond-buying operations and the European fiscal policy response: a package of measures from the European Commission (EC), European Investment Bank (EIB) and ESM worth a combined €540 billion as well as the Next Generation EU of €750 billion.
In a previous blog post, we illustrated the restoration of calm in markets following Europe’s response to the pandemic crisis. A blog post from a colleague in ESM Investment and Treasury showed how Europe’s pandemic response reduced market uncertainty. In this blog post, we show how trading in ESM and EFSF bonds developed through and after the pandemic and then go deeper into which investors and regions reacted and traded ESM and EFSF bonds on the back of the policy response.
To do this, we examined the performance of our bonds in the so-called secondary market. Once issued by us in the primary market, bonds can then be traded in the secondary market until their maturity date. Although the pandemic’s economic effects triggered fluctuating market prices, ESM and EFSF secondary markets overall confirmed the bonds’ status as safe assets by showing solid buy-and-sell turnover and yield spread widening in line with general market movements.
We examine the yield spread, the difference in the realised return of two bonds or financial instruments, in ESM and EFSF bonds versus derivative contracts designed to exchange fixed-rate payments for floating-rate payments, known as euro interest rate swaps. Such swaps are used as a benchmark for European bond prices. Bonds in Europe are often priced against swaps instruments.
ESM unique database
Using granular trade data[1] of ESM and EFSF bond issues on the secondary market unique to our institution, we analysed closely their behaviour during the first Covid-19 wave of March to June 2020, the summer months with lower infection rates, and the beginning of the second wave in November 2020.
It is worth noting that we estimate ECB held between 45% and 49% of EFSF and ESM’s outstanding stock of the eligible debt under Public Sector Purchase Programme (PSPP) in 2020[2]. With the addition of PEPP, we assume ECB holds above 50% of our debt. In this analysis, we exclude the flows related to ECB or Eurosystem central bank holdings and focus on the remaining part: the trading of the free floating securities.
From our analysis, we learned that in 2020 secondary markets stayed intact, with a particularly supportive private domestic investor base. In our case, non-central bank euro area investors. This indicates investor confidence in a healthy euro and Europe’s policy response. The announcement of the policy measures from ECB, EC, EIB and ESM already allayed investors’ concerns and encouraged them to continue trading ESM and EFSF bonds even during the peak of the crisis.
We note that the clearest effect of the pandemic in terms of changes in secondary market volumes and prices can be seen for bonds with a remaining maturity of seven to 12 years. This very liquid market segment represents about 22% of the ESM and EFSF secondary market turnover and demonstrates price dynamics that also represent other maturities. We discuss their spread levels, traded volume, and the reaction of different investor types.
Secondary market yield levels of ESM and EFSF were strongly affected by Covid-19, but not more than similar safe assets such as Germany.
Figure 1A shows the yields of the 10-year benchmark bonds from Germany and from the ESM and EFSF during 2020. Bond prices are inversely related to their bond yields. From mid-February to mid-March, the yields decreased sharply in lockstep, so the bond prices increased, delivering on their function as safe assets. In a sharp reversal afterwards, the two markets also happened to move closely together. The second wave of the pandemic did not lead to a comparable market event again.
Well-functioning ESM markets
As the data shows, the turnover in the secondary market was solid and indicated well-functioning ESM and EFSF bond markets - despite significant temporary widening of credit and liquidity spreads.
Figures 1B and 1C show the secondary market trades of the ESM and EFSF bonds with a remaining maturity between seven and 12 years in 2019 and 2020. Each figure shows a different spread for each trade. Both charts distinguish between buying (yellow) and selling (blue) and show the trade size with circles proportional to the traded volume. This gives information about a measure of liquidity, the turnover volume.
Figure 1B depicts the asset swap spread, the yield difference to the reference swap rate, of the specific ESM bond. This spread can indicate risk taken by an investor that the issuer of the bond will fail to repay interest and principal on schedule, known as a credit risk. Hence, a larger asset swap spread indicates an increased credit risk.
Figure 1C shows the bid-ask price spread[3], the difference between the buy price and the sell price. This is a widely used liquidity measure: a small difference between buy and sell price indicates a good liquidity situation.
We saw no market shutdown during the pandemic as investors bought and sold bonds throughout, with the larger-sized trades happening between February and June 2020. Moreover, there was no widening in price or yield spreads observed. Again, this shows Europe’s policy response led to calm market conditions.
The turnover was high during the first wave but stayed low in the second. Both spreads were widening dramatically in the second half of February and during March. The bid-ask price spreads approximately doubled to 0.40% from 0.20%, and the asset swap spread jumped to 0.10% from about -0.10%. These high spread levels continued throughout April, followed by a decrease of spreads in May and stable yet elevated levels in June, July, and August. The second wave’s impact was much weaker. In September the asset swap spreads rose steadily by about 0.5%, but fell by the same amount in October and November.
In between the first and second wave in the summer, the market had calmed and the deviation of spread levels across bonds was larger than before the crisis. The deviations in credit risk and liquidity seems consistent with the lower trading volumes observed during summer and not a result of large differences in duration as all bonds belong to the same seven to 12 years maturity range.
Figure 1 A-C: Financial markets’ reaction to the pandemic crisis: generic 10 Year bond yield (A), asset swap spread (B) and price spread (C).
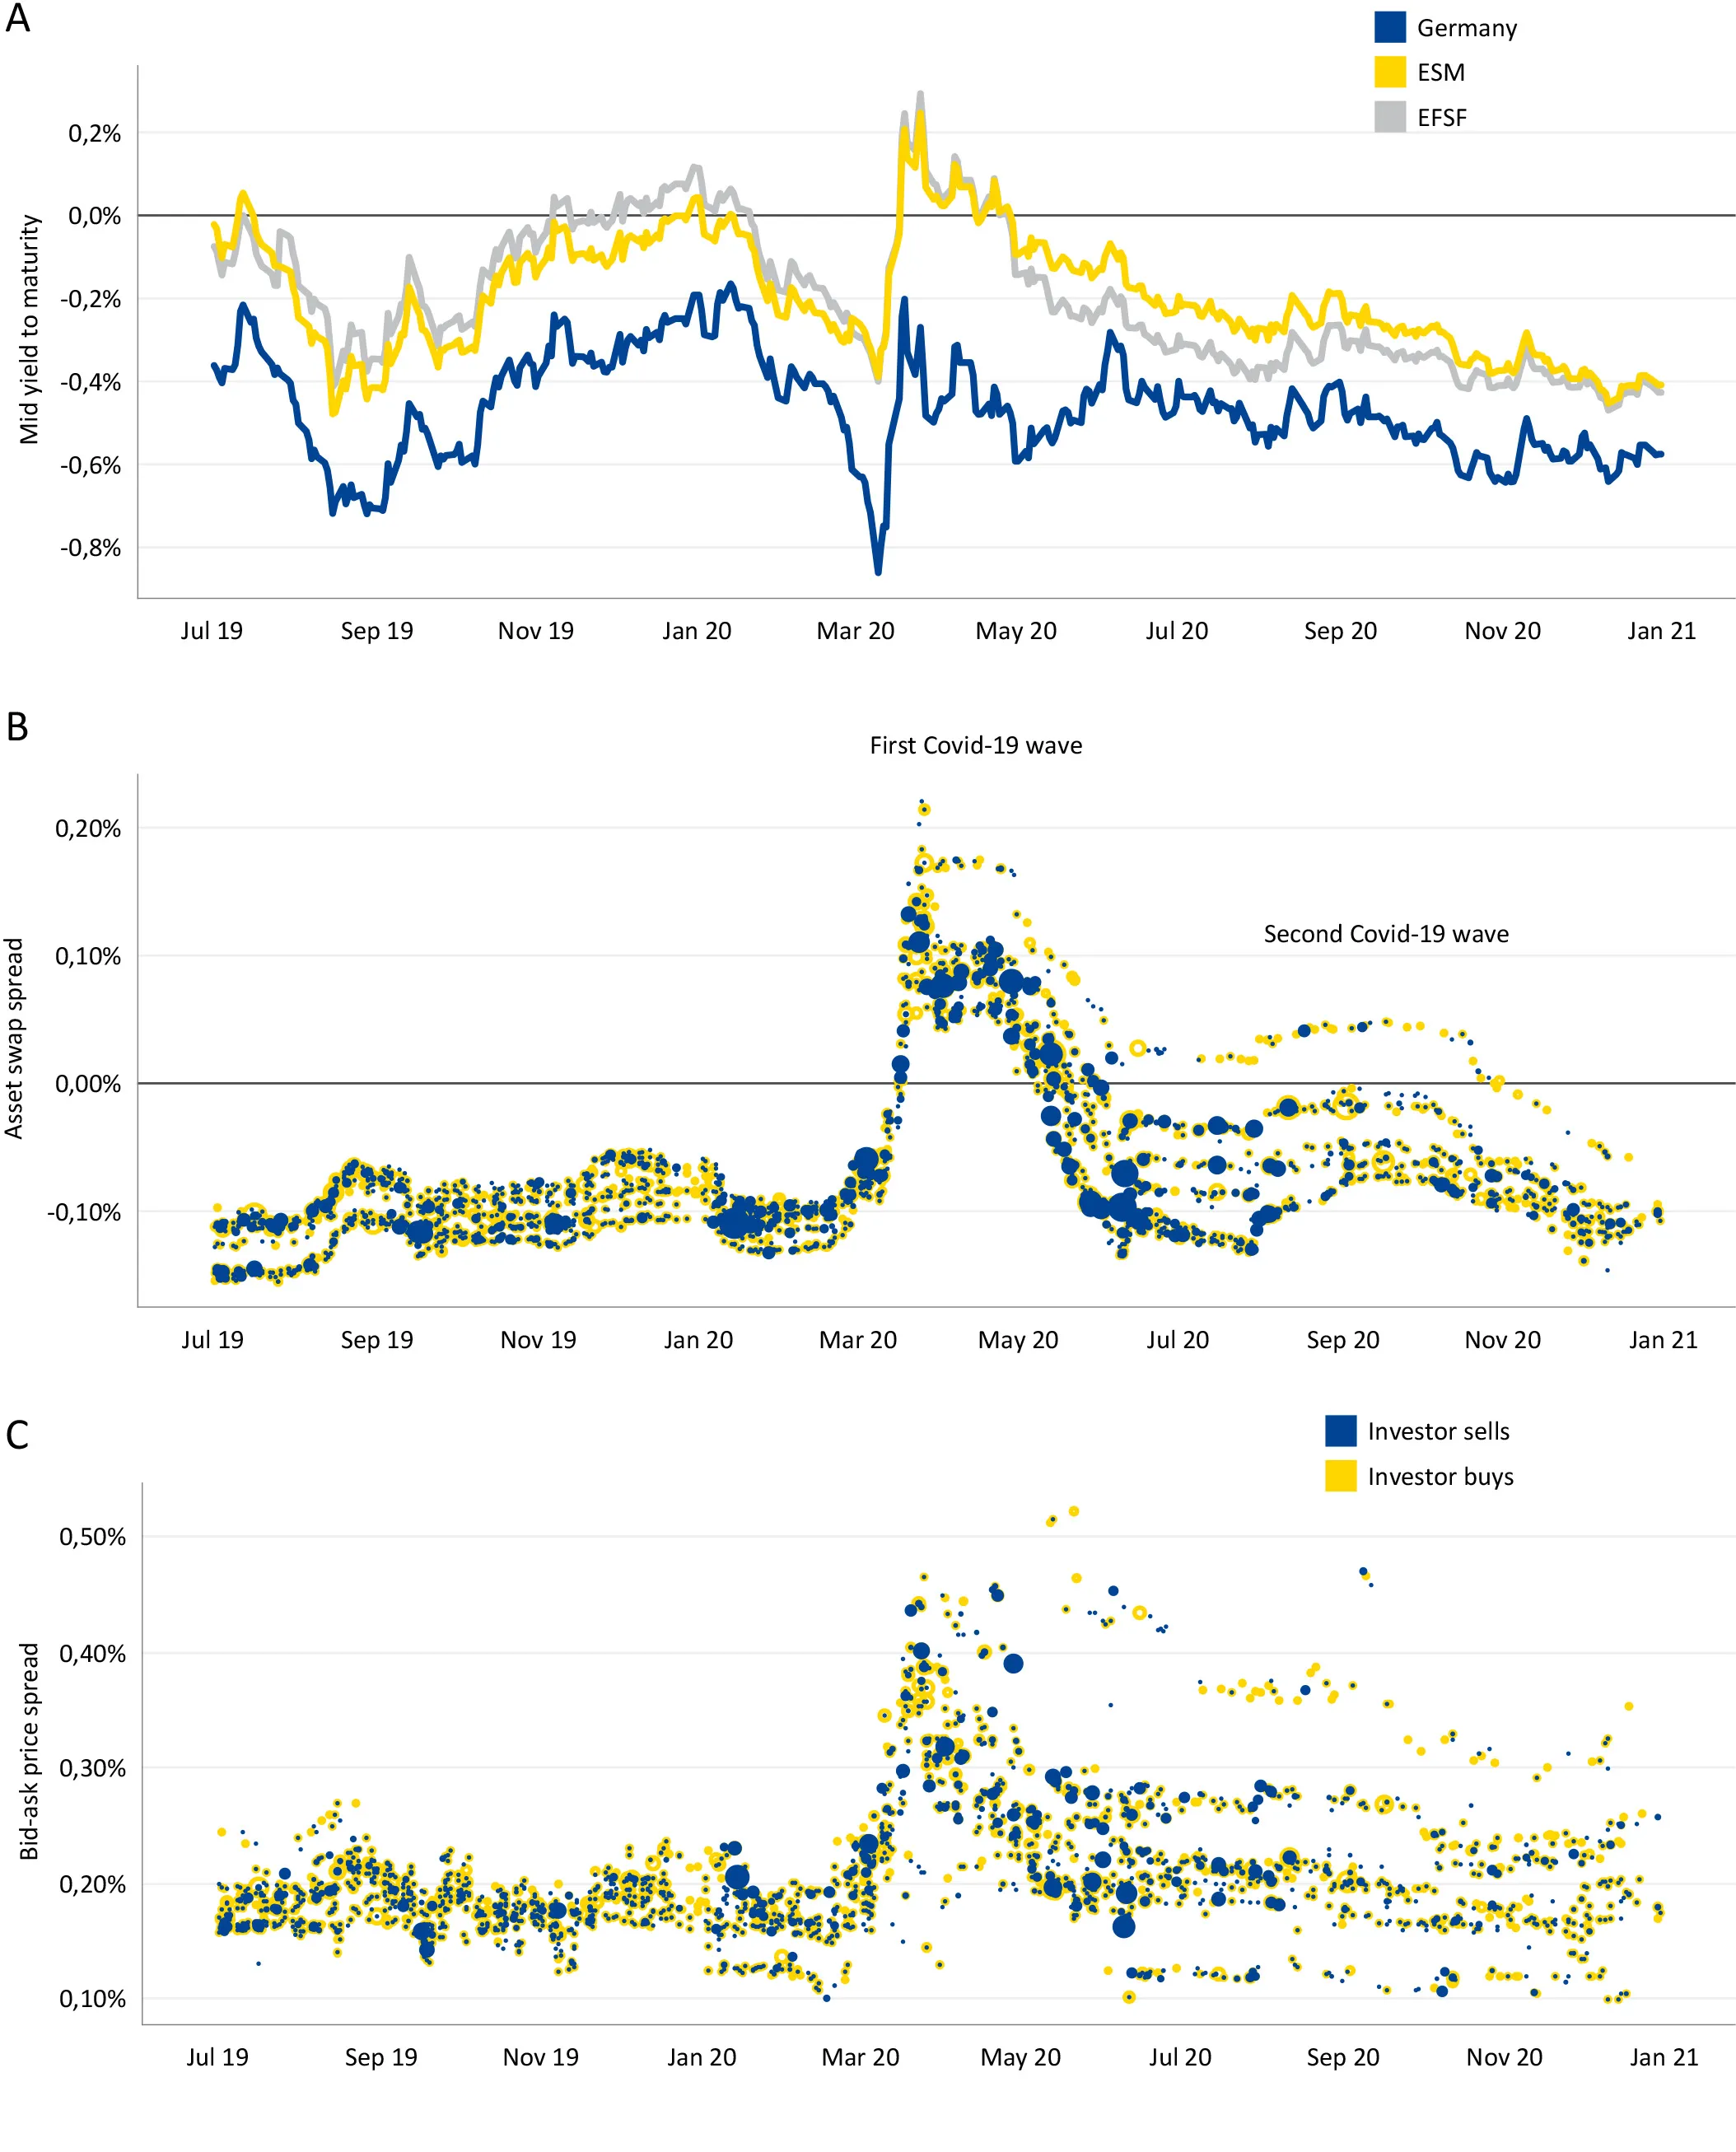
Source: ESM internal data and Bloomberg
What we noted was the solid two-way trading during first wave, mainly from European private sector investors, which was made possible by the positive effects of the European policy response to coronavirus.
In Figure 2 we illustrated the actual monthly buy and sell orders. It should be noted that the central banks category excludes the ECB and Eurosystem central banks.
Figure 2A shows a monthly aggregation of buy and sell transactions from investors. The breakdown confirms the increased flow during the first wave of the pandemic in both directions, so the pandemic did not simply trigger a “sell” wave. Instead, convinced by the European policy response measures, investors were confident of holding ESM and EFSF bond positions and hence were both buying and selling bonds throughout 2020.
Figures 2B and 2C show the monthly secondary market flows of all ESM and EFSF bonds with a remaining maturity of seven to 12 years from 2019 to 2020. Figure 2B depicts these for the different investor types and Figure 2C for the regions.
From March to July 2020 we see net selling by all investor types except for brokers or non-euro area central banks, whereas fund managers and pension and insurance funds started net selling already in January. Non-euro area central banks and other public investors only play a considerably smaller role than private sector investors.
During the crisis, euro area investors became the most prominent and important investors for bonds from the ESM and EFSF, demonstrating the relevance of the domestic investor base in crisis times. There was a strong net selling from investors outside the euro area and UK and Switzerland from March to June 2020. Furthermore, the UK and Swiss investors were less active in the market than in 2019. UK investor volumes were overall lower than the aggregated euro area volumes in that period.
Figure 2 A-C: ESM and EFSF secondary market trading turnover: buy and sell flows per investor type and region
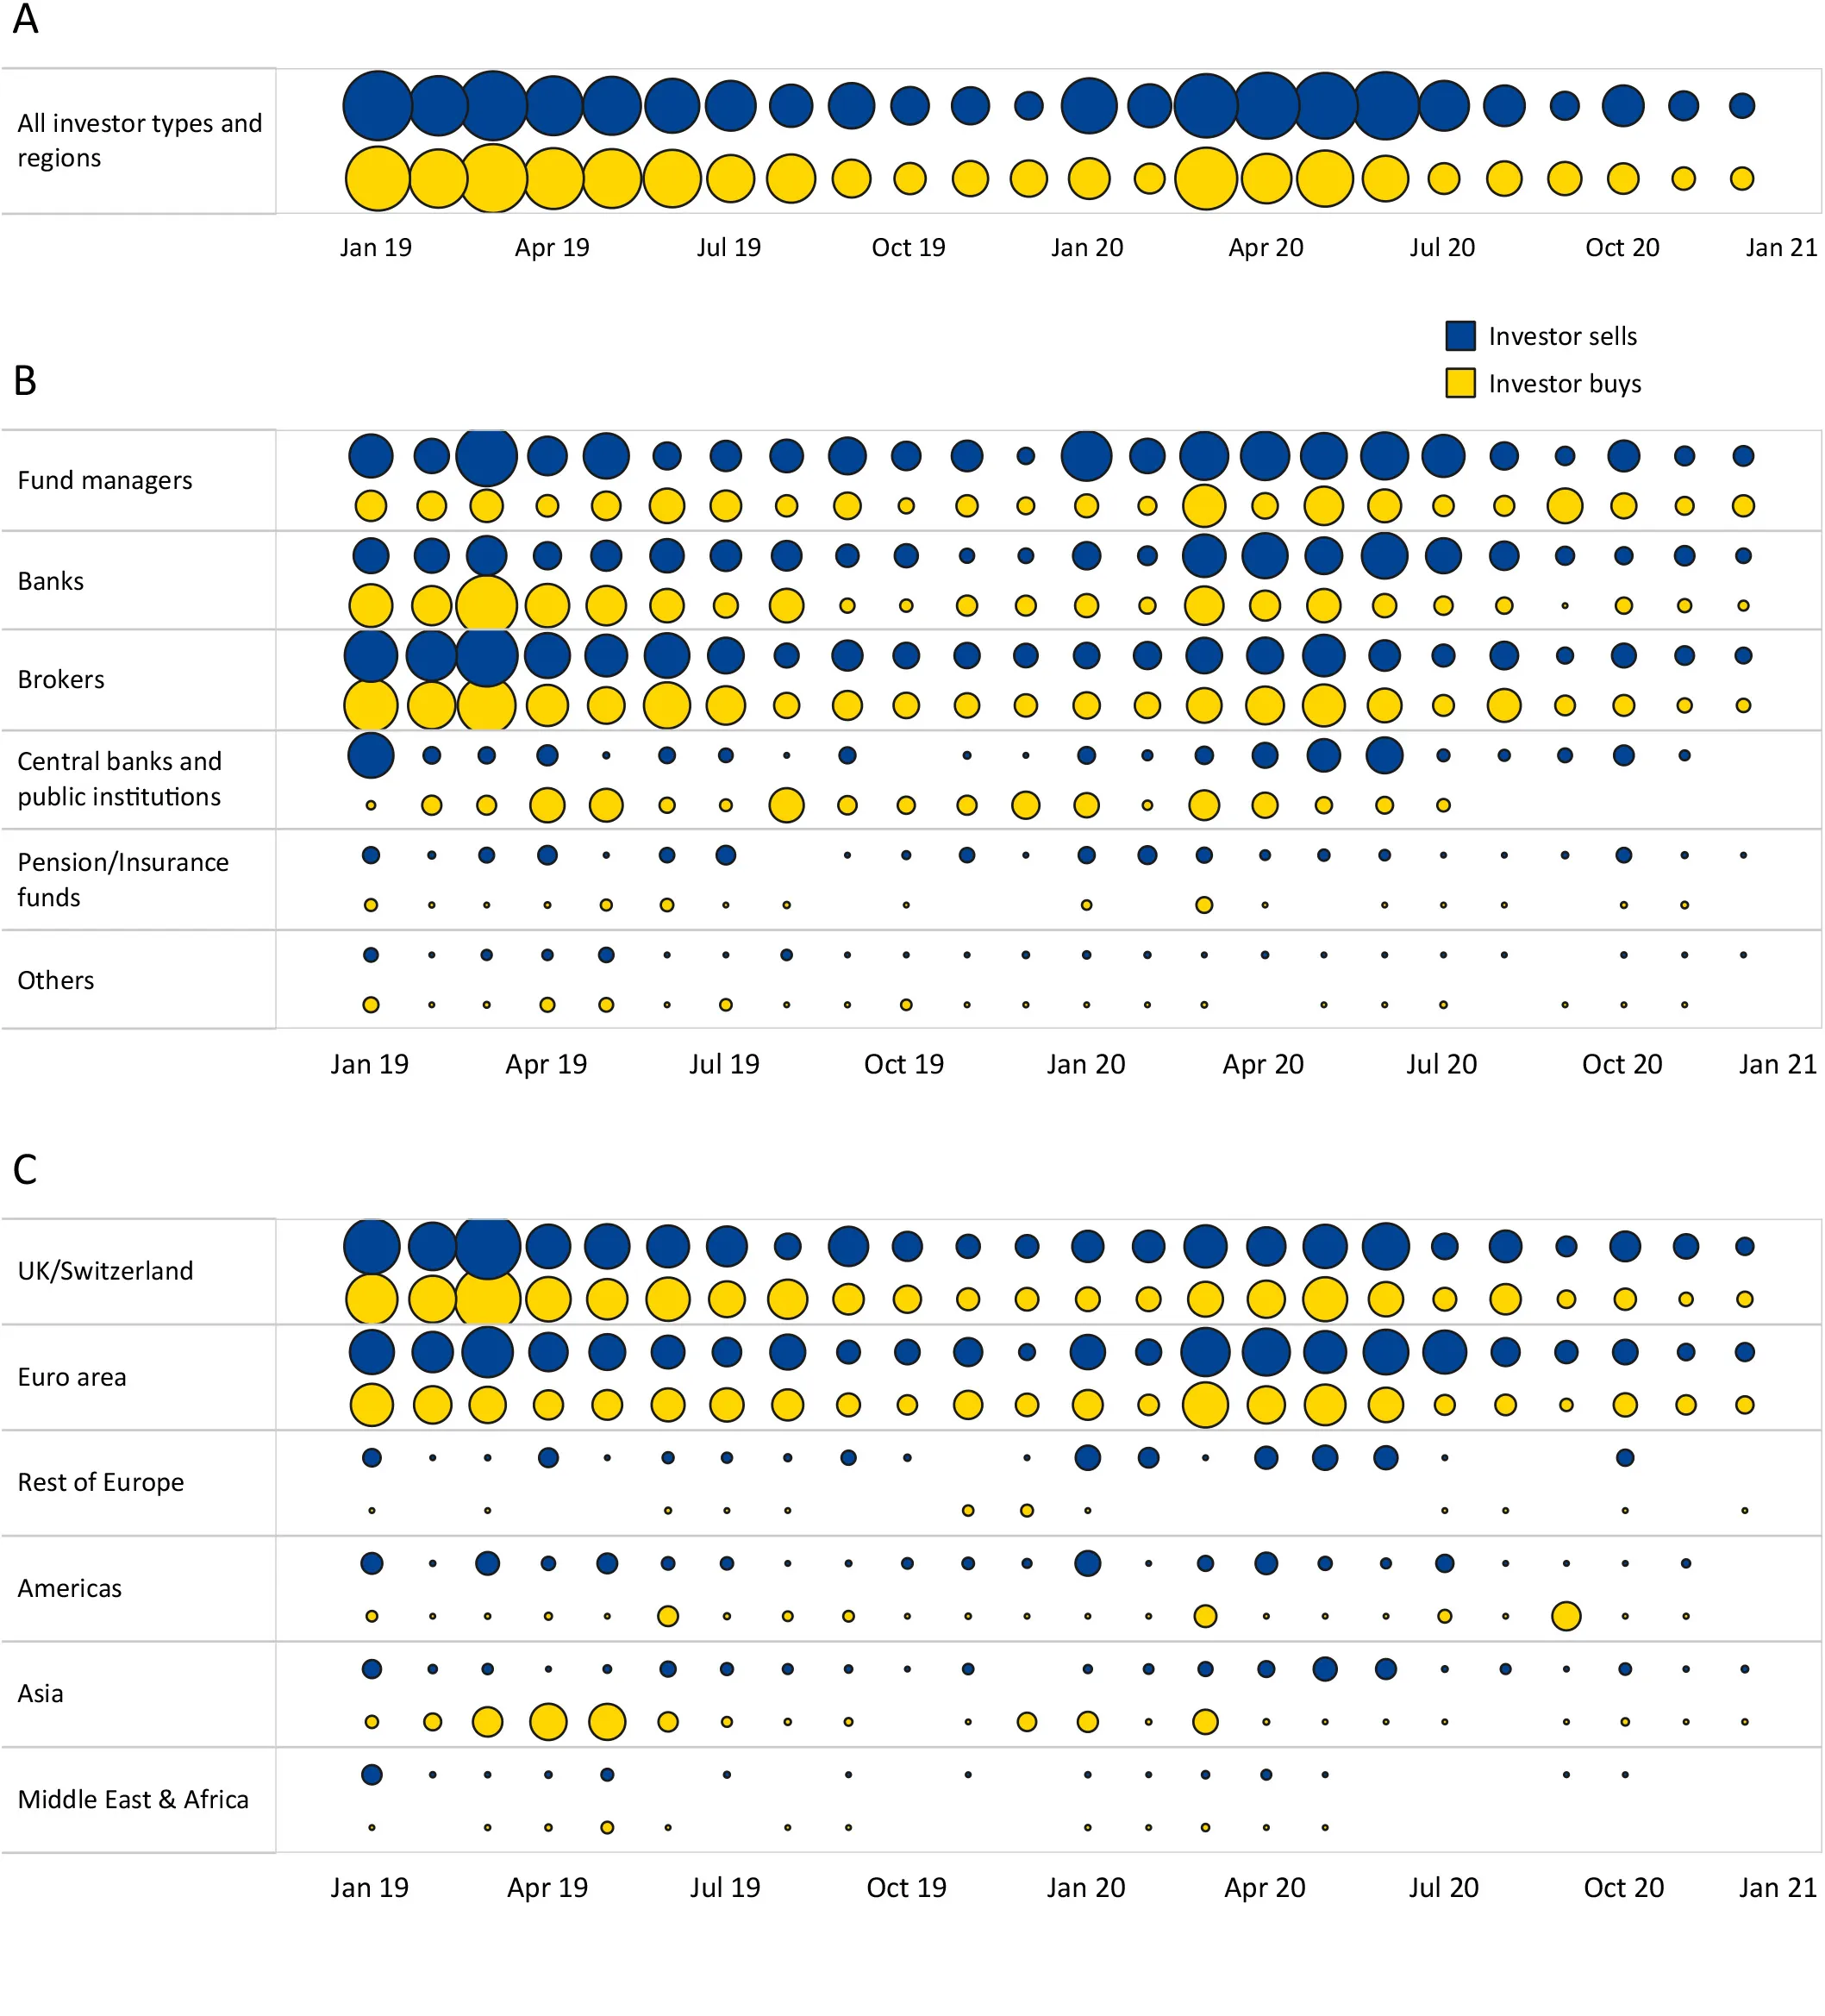
Figure 2B excludes ECB/Eurosystem central banks
Source: ESM internal data
Overall, ESM and EFSF secondary markets showed solid buy-and-sell turnover and only moderate spread widening throughout the pandemic, thanks to a strong private domestic investor base. The market was much calmer in the second wave than the first. While an increased credit risk perception could be observed in the first pandemic wave in spring 2020, this was not the case in the second wave that autumn.
We conclude that for the Covid-19 pandemic, a fast and determined European policy response convinced particularly the domestic private investor base, of a well-functioning secondary market. More generally, measures aimed at strengthening the domestic market, such as a further deepening of the capital markets union also strengthen domestic issuers and make them more resilient.
Acknowledgements
The authors would like to thank Peter Schwendner and Lorenz Breitsamter who participated in the underlying research activity and substantially contributed to the ideas within this blog post. The authors would further like to thank Kalin Anev Janse, Jürgen Klaus, George Matlock, Anapaula Garcia Soto, and Silke Weiss.
Further reading
Why the Covid-19 credit line still makes sense How Europe’s pandemic response reduced market uncertainty
Footnotes
About the ESM blog: The blog is a forum for the views of the European Stability Mechanism (ESM) staff and officials on economic, financial and policy issues of the day. The views expressed are those of the author(s) and do not necessarily represent the views of the ESM and its Board of Governors, Board of Directors or the Management Board.