Assessing sovereigns’ market access in the euro area

Is it possible to forecast tensions in market access? How does one measure such tensions and how do they evolve over time? Looking back at the experiences of Spain and Greece during the European debt crisis and the ongoing pandemic helps to answer these questions. In the run-up to the European sovereign debt crisis, several financial and macroeconomic indicators already signalled a build-up of stress in the debt markets. Now, the situation looks much better, with vulnerabilities broadly contained, although some indicators have started flashing amid the current pandemic crisis.
In this blog post, we will show that macro-financial indicators can signal risks to market tensions before they materialise, giving policy-makers as much as a year forewarning to tailor a response to the unique origin and impact of each crisis. Economic discipline and reforms stemming from the debt crisis as well as timely and appropriate policy response are helping European countries to better tackle new crises such as the Covid-19 pandemic today.
Were the market access of a country impaired, then the country either could not borrow money to fund itself at sustainable interest rates or could not find the necessary demand at all. During the debt crisis, several countries in the euro area experienced such extremes for the first time. For the purpose of illustration, we use two cases from the sovereign debt crisis: Spain and Greece. Spain experienced high market tensions, while Greece lost its market access.
The following heat maps (Figures 1 and 2) contain six indicators that provide signals on the evolution of market access conditions from the first quarter of 2008 to the third quarter of 2020. Red denotes periods when the relevant indicator is signalling market tensions. The deeper the colour, the more serious the tension is. Blue indicates periods of calm market access.
Early signals of market stress in the European debt crisis
In the run-up to the European sovereign debt crisis, Spain’s access to financial markets grew severely strained and raising money became increasingly expensive. When investors demanded onerously high interest rates to purchase long-term sovereign debt, Spain responded by boosting its issuance of less expensive short-term debt. As a result, in our first indicator of distress, Spain’s issuance of Treasury bills (T-bills) as a share of its gross domestic product (GDP) spiked in 2011. Second, the gap between the price that investors were willing to pay for an asset and others to sell it, the bid-ask spread, widened significantly, with transactions drying up as buyers and sellers were too far apart to trade. Third, the share of foreign-held sovereign debt dropped, more than a year before the Spanish programme began in July 2012, as investors perceived those investments as increasingly risky. Fourth, ahead of the Spanish bank recapitalisation programme, credit default swap (CDS) prices, a proxy for credit risk, rose to levels more than three times higher than those at the start of the systemic financial crisis in Spain. Finally, two further indicators, forecasts of government debt and gross financing needs, soared in advance of the Spanish programme.
Figure 1: Spain returned to solid market access after the banking recapitalisation programme
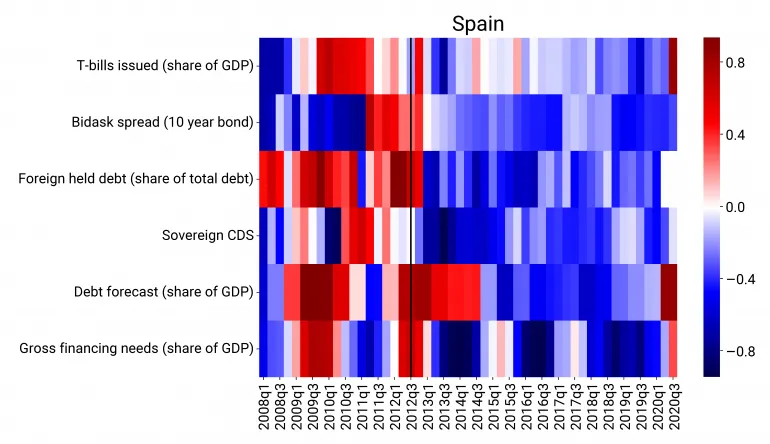
Notes: Red denotes periods when an indicator is above its critical value for signalling tensions in market access, and blue denotes a period when it is below. The darker the colour, the more distant an indicator is from its critical value in a given period. The black vertical line represents the start of the Spanish banking recapitalisation programme. T-bill issuance is compared to a country’s historical average, while the other indicators are compared to a euro area average of 14 countries (Belgium, Germany, Ireland, Greece, Spain, France, Italy, Latvia, Netherlands, Austria, Portugal, Slovenia, Slovakia, and Finland). Source: ESM.
The deterioration of the economic and financial situation in Greece was substantially more severe than in Spain during the euro crisis. Market perceptions of credit risk, as reflected in prices of CDS, increased more than six fold shortly before the approval of the first programme in May 2010 from levels at the start of the crisis. The share of T-bills issuance jumped to 27% in mid-2009 from pre-2008 levels of below 5%. The share of foreign-held sovereign debt declined by 25 percentage points in the second quarter of 2010 compared to the third quarter of 2009, while over the same period forecasts of government debt soared by 25 percentage points to around 134%.
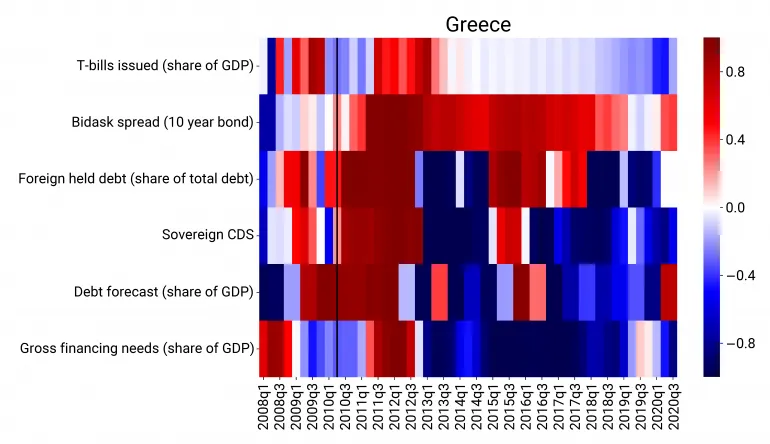
Notes: Red denotes periods when an indicator is above its critical value for signalling tensions in market access, and blue denotes a period when it is below. The darker the colour, the more distant an indicator is from its critical value in a given period. The black vertical line represents the start of market access tensions for Greece. T-bill issuance is compared to a country’s historical average, while the other indicators are compared to a euro area average of 14 countries (Belgium, Germany, Ireland, Greece, Spain, France, Italy, Latvia, Netherlands, Austria, Portugal, Slovenia, Slovakia, and Finland). Source: ESM.
Normalisation of market access conditions
Increasing market access tensions pushed Spain to request financial assistance from the ESM in July 2012. The programme was needed to repair Spain’s banking sector, which was at the heart of its financial stability problems. Both ESM stability support – which implied long-term loans at favourable conditions – and repairing its banking sector, helped Spain to rebuild investors’ trust and overcome restrictions to market access. These achievements can be seen in Figure 1 as the indicators turn from red to blue, signalling improvement in market tensions. After the programme exit, Spain extended debt maturities while lowering its funding costs. Bond market liquidity – shown by the bid-ask spreads of the 10-year bond – improved quickly and foreign investors returned. Gross financing needs and government debt stabilised.
This picture looked different for Greece. Even after the start of the first Greek stability support programme, many indicators of market access tensions remained far beyond critical values and eventually led to loss of market access (as shown by the ever-deepening red colour in Figure 2). Due to its more pronounced economic challenges, Greece needed time to conduct the necessary reforms and overcome its structural problems to regain investor trust. When the effects of the reforms kicked in and the overall crisis abated, Greece was able to approach markets again with first issuances in 2014. However, with the change in government in early 2015, market tensions re-emerged due to high uncertainty about the access to financial support and its reform agenda.
In recent years and after the end of the last stability support programme in August 2018, the situation in Greece has much improved with some indicators turning blue again. It is still apparent that Greek market access needs to progress and the liquidity situation has room for improvement. At the same time, ESM loans helped to keep refinancing needs very low over a long period in time and give Greece the necessary budgetary breathing room to fully reassert its market access. Continued growth-enhancing reforms will help to sustain investors’ trust.
Less market stress than previous crisis
During the current pandemic, neither Spain nor Greece’s secondary market indicators signal any broad-based build-up of vulnerabilities and market tension. More specifically, sovereign CDS prices show no signs of distress, nor do foreign investors appear to have begun fleeing the bond markets.
However, fiscal indicators have started to reflect deterioration caused by the pandemic. Public debt projections have increased substantially across Europe due to higher funding needs and GDP losses. Amid uncertain macroeconomic and funding outlooks, increased issuance of T-bills has given Spain flexibility to roll out their long-term debt issuance strategy, ultimately leading to longer overall average debt maturity.* No elevated short-term debt issuance has been observed in Greece.*
Well-coordinated policy responses to Covid-19 have been playing a key role in this crisis by supplying liquidity to the economy, containing unemployment, limiting hardship for households and fostering market sentiment conducive to sovereign funding. ESM’s contribution is the Pandemic Crisis Support credit line, up to €240 billion combined volume available to all euro area countries to support healthcare, cure, and prevention costs related to Covid-19-loans free from conditionality. Swift and effective intervention by the European Central Bank in the sovereign bond markets has helped to mitigate their malfunctioning, and Europe’s large-scale fiscal package has further calmed the markets.
In analysing market access tensions, a broad range of economic and market indicators is relevant. Notably, combining several variables is more powerful at foreshadowing periods of strong market access stress in the euro area. Applying a battery of econometric and machine learning-type models of varying complexity to euro area countries over the past two decades, we found indicators that signal those periods with substantive accuracy (for details and methodology please see ESM Working Paper 42: "Quantifying risks to sovereign market access: Methods and challenges"). This information gives policy-makers a heads-up on trouble ahead, granting them additional time to craft an appropriate response.
* updated on 25 November 2020.
Acknowledgements
We thank Rolf Strauch (ESM) for his valuable contribution and input to this blog.
This blog was written while Xu Jiang worked for the ESM.
Further reading
ESM (2017), EFSF/ESM Financial Assistance - Evaluation report
Independent Evaluator (2020), Lessons from Financial Assistance to Greece
Khor, H. E. and Strauch, R. (2020), Same crisis, different responses to Covid-19
Revoltella, D., Strauch, R. and Verwey, M. (2020), Helping people, businesses and countries in Europe
Strauch et al (2016), Accessing sovereign markets - the recent experiences of Ireland, Portugal, Spain, and Cyprus
Žigraiová, D., Erce, A. and Jiang, X. (2020), Quantifying risks to sovereign market access: Methods and challenges
About the ESM blog: The blog is a forum for the views of the European Stability Mechanism (ESM) staff and officials on economic, financial and policy issues of the day. The views expressed are those of the author(s) and do not necessarily represent the views of the ESM and its Board of Governors, Board of Directors or the Management Board.

Blog manager
