Impact on Budgets
In all its programmes, the ESM/EFSF passes on its low funding cost which provides a significant amount of savings in programme countries’ budgets, year after year.
EFSF/ESM were setup to provide financial assistance to euro area countries that could no longer access capital markets at affordable rates. Cyprus, Greece, Ireland, Portugal and Spain obtained loans from the EFSF/ESM at much lower interest rates than those that would theoretically have been offered by the market (see technical detail below).
This generated -and continues to generate - substantial budgetary savings, helping to provide additional leeway to implement fiscal and structural reforms to foster growth, and thereby ultimately supporting market access and debt sustainability.
This is a real solidarity contribution by euro area partners which is often disregarded.
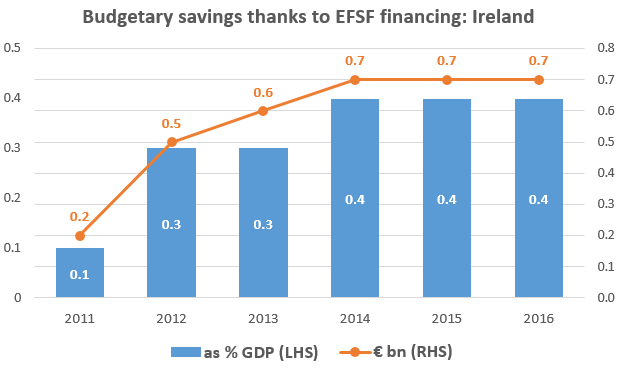
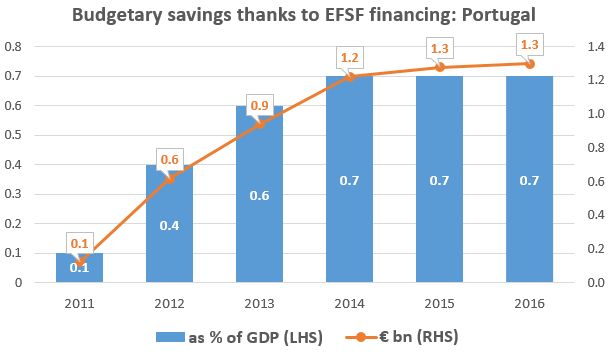
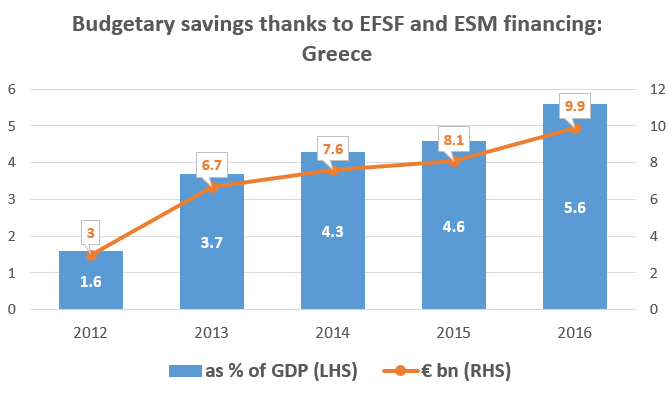
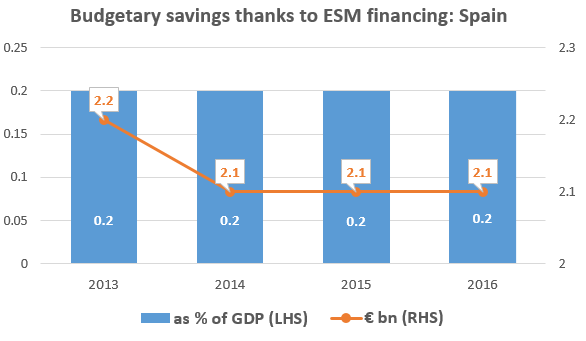
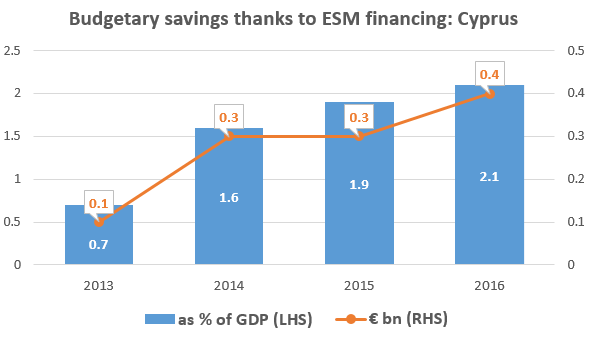
The chart above shows the results in terms of amounts saved and as percentages of GDP since 2011. Given the massive size of the financial support, the financial advantage is by far the largest for Greece, amounting to 5,6% of GDP in 2016, combining ESM, EFSF and another 0.7% of savings from the deferral of interest rates (which will however come due after 2022). But benefits are significant also for other programme countries and they have increased in all cases with the disbursement of the programme.
At the peak of the crisis, savings were even larger: towards the end of 2013, countries such as Ireland and Spain (and to a lesser extent Portugal) were already approaching the conclusion of their programmes and were benefiting from lower spreads due to the effective crisis response and good programme implementation.
The chart also shows how the impact of cheap lending outlives the period of the programmes and will last for many years to come. Savings have slightly decreased recently for Ireland in view of their improved financing conditions. However this effect is expected to be temporary, when the more expensive loans provided initially under EFSF mature.
How did we calculate theoretical market rates?
We estimate these savings by comparing the effective interest rate payments on EFSF/ESM loans with the interest rate that these countries would have paid had they been able to cover their financing needs in the market in the absence of disruption.
Both the entire history of disbursements in programme countries and the effective cost charged to countries is taken into account, as to reflect the market rate at the point in time at which every disbursement could have been financed in the market.
Every single disbursement is valued at the average market 10-year bond yield in a year. This yield then is applied for a 10 year period, but will be reset when the loan is rolled over. This maturity is taken as a proxy long-term market rate though probably the actual average market re-financing would be done at a shorter maturity in periods of stress. However, the 10 year rate is a generally accepted benchmark for long-term debt, this rate is usually available on a comparable basis, and the market may forward looking be more liquid than other maturities.
Generally market rates are appropriate for this exercise but may be questioned under extreme crisis situations when they “skyrocket”. In this case, a cap of 6.4% is applied to the market rate.
Why 6,4%? At the height of the European debt crisis, an elevated yield approaching 7% has often been associated with significant sovereign stress and imminent loss of market access. While the specific number varies per economy and is dependent one’s assumptions on future primary surpluses and nominal growth rates, the consensus of market analysts given the global environment was that yields in this range were incompatible with sustainable debt. These views are supported by the development of market yields preceding the requests for official assistance in the case of Greece (April 2010), Ireland (November 2010) and Portugal (April 2011), which all show yields rapidly accelerating once these levels are exceeded. Similarly, in November of 2010 one of the larger central clearing houses announced higher margin requirements for sovereign bonds that exceeded a spread of 450 basis points over 10-year Germany, suggesting an increase in sensitivity at yields close to 7%. So there are various reason to assume a cap below 7%. Empirically, the maximum yield at which countries in the Euro area have been able to issue over the past eight years has been 6.4%. Therefore, we assume this as relevant benchmark.