The five euro area countries that requested financial assistance from the EFSF or ESM suffered from a number of problems. One key weakness that led some of them down the wrong path economically: a structural imbalance in their growth model. This model relied strongly on domestic demand fuelled by unsustainable government spending, large wage increases, and surging private indebtedness funded by foreign creditors. High wage rises combined with low productivity growth made domestic goods and services more expensive and less competitive on international markets.
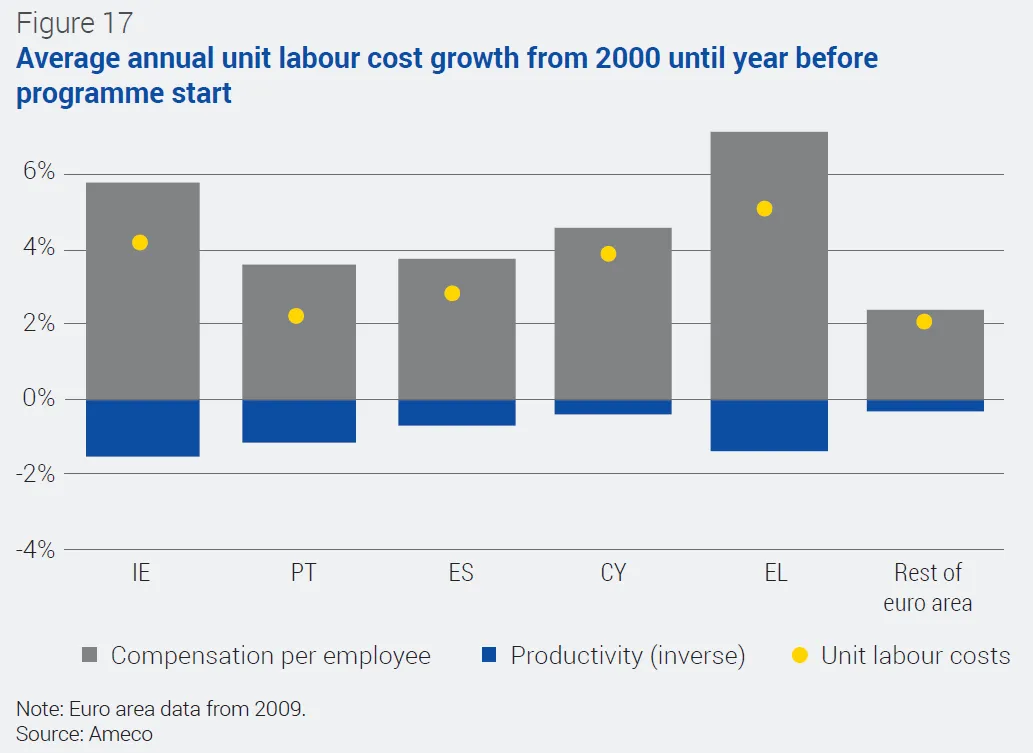
In the decade before the adjustment programmes started, all five programme countries experienced a sharp decline in international competitiveness.8 While wage growth also outstripped productivity growth in the euro area as a whole, the increase in unit labour costs was more pronounced in most of the programme countries (Figure 17). Spain and Cyprus passed on a larger share of these climbing nominal labour costs to prices9 than their 36 trading partners and competitors,10 while prices in Ireland and Greece remained broadly unchanged relative to their trading partners. With the exception of Portugal, the increase in nominal unit labour costs relative to trading partners exceeded relative price rises. Hence, labour became more expensive in real terms before the crisis, reducing profitability in an international comparison (Figure 19). The appreciation of the euro contributed to losses in price competitiveness vis-à-vis non-euro area countries.
In a currency union, the toolkit available to countries to regain competitiveness no longer includes currency depreciation. Instead, the currency union members need to produce goods and services of higher quality, produce more efficiently, or if this does not suffice, reduce labour costs relative to competitors as part of a rebalancing process – these measures contribute to a so-called internal devaluation.11 The first two measures target structural improvements, which typically require a longer implementation period. With the latter, countries could, in principle, take action more quickly; however, acting on wages, while necessary during the crisis period, can be socially and politically costly. This may require reforms because minimum wages, sectoral wage agreements, or the degree of centralisation of wage negotiations can hamper a lowering of wages or decelerated wage rises.12
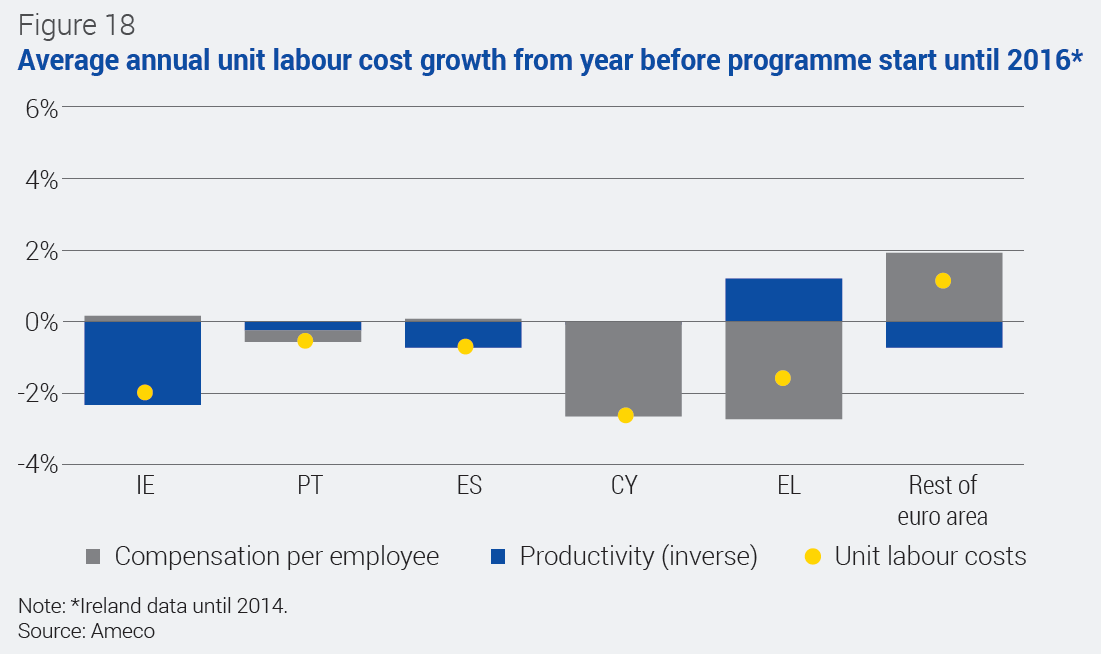
The EFSF and ESM economic adjustment programmes for Ireland, Greece, Cyprus, and Portugal took these factors into account. The programmes encouraged countries to foster a flexible business environment and remove distortions from product and labour markets. They adopted various approaches to achieve internal devaluations: reductions or freezes of minimum wages or reconfigurations of the wage-setting process.13 As a result, these four countries accomplished significant price competitiveness gains. This was also the case for Spain which, even outside a full economic programme, benefited from the implementation of significant structural reforms.14 While in the euro area as a whole productivity growth has been below nominal wage growth since 2009, the reverse was true in all programme countries. In Ireland and Spain, the decline in nominal unit labour costs was driven by productivity improvements, albeit in Spain these partly resulted from a significant fall in employment. In Cyprus and Greece, the adjustment took place predominantly via marked reductions in compensation per employee (Figure 18). In Portugal, the overall decline in unit labour costs was more limited than in the other programme countries but quite pronounced when compared with trading partners and competitors.

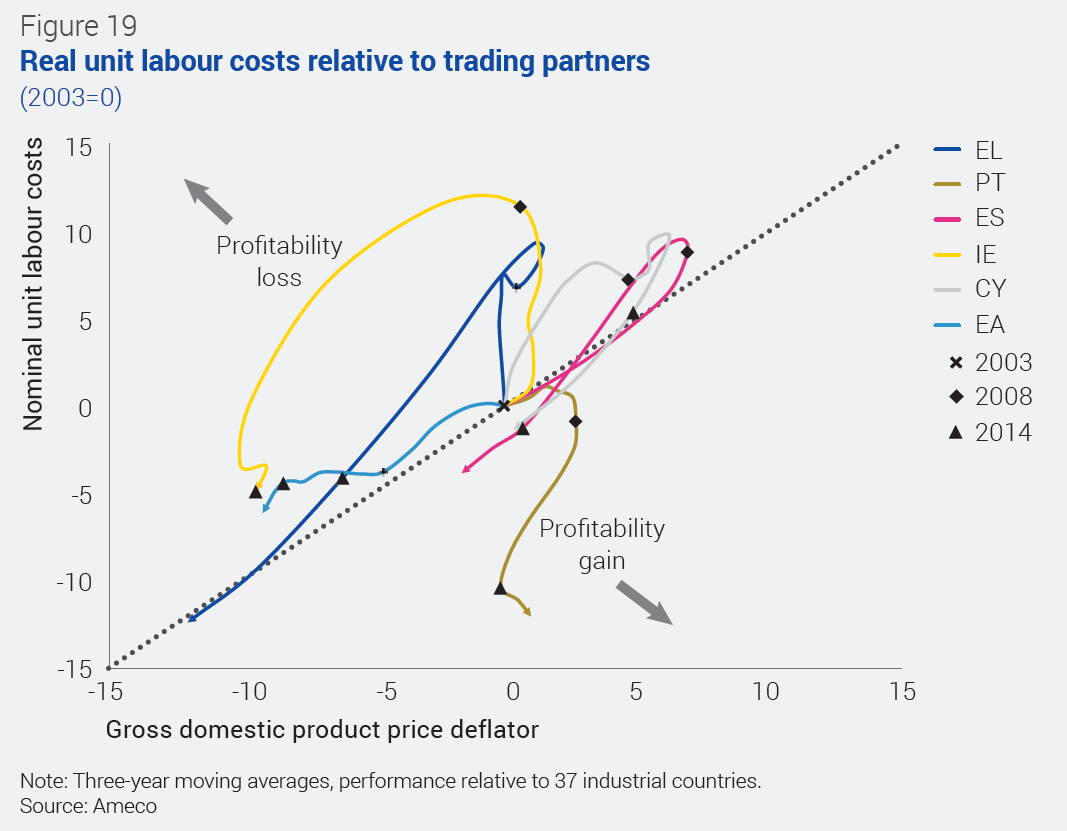
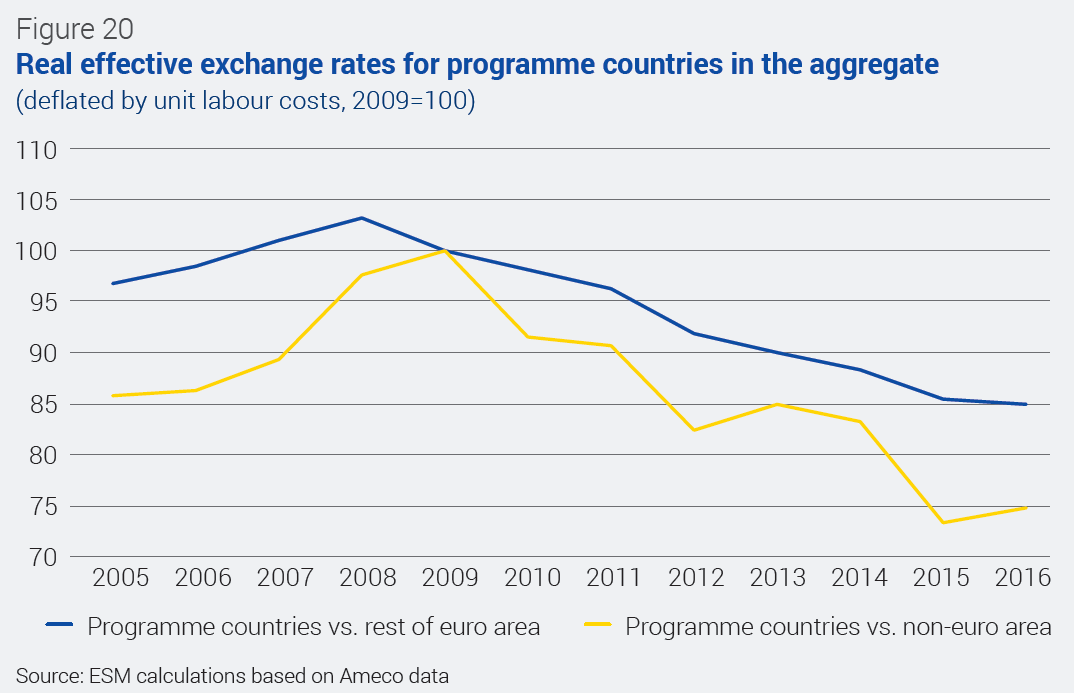
The euro area’s overall nominal unit labour costs increase did little harm as competitors also suffered from rising unit labour costs (Figure 19). Prices charged by euro area firms, however, rose less than in the other countries, cutting into their profit margins with a resulting rise in relative real unit labour costs. In contrast, all programme countries managed to reduce their real relative unit labour costs and thereby secure a comparatively more profitable business situation since the start of their programmes. Taking all programme countries together, the more pronounced decrease in relative nominal unit labour costs suggests a marked improvement in price competitiveness over other euro area countries since 2008. To complement the assessment of the competitive stance of the programme countries vis-à-vis non-euro area countries, changes in the exchange rate have also been taken into account (Figure 20). The euro’s depreciation prompted an even stronger improvement in the real effective exchange rate (based on unit labour costs) vis-à-vis the rest of the world. Compared to each other, the competitive position of the programme countries did not change as much, which reflects the simultaneous internal devaluation process. Figure 20 also shows, however, that the improvement in the programme countries’ real effective exchange rate has been bottoming out since 2015. In 2016, nominal unit labour costs rose in three out of five programme countries.
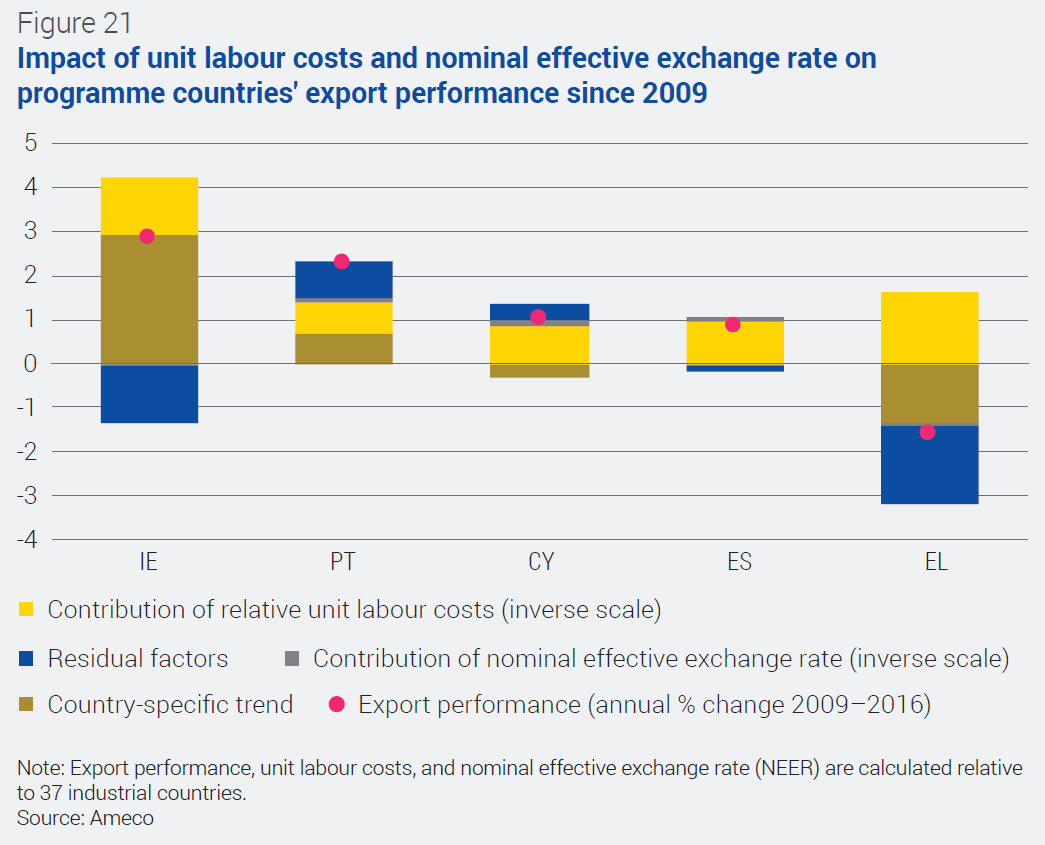
ESM internal research supports the conclusion that relative unit labour cost improvements boost export performance.15 According to the results of a statistical analysis of 11 euro area countries, a 1% decrease in nominal relative unit labour costs translates into a 0.52% increase in export performance, which can be interpreted as a gain in export market share.16 The programme countries' shares in international export markets have benefited decisively from labour cost reductions compared to their trading partners and competitors since 2009 (Figure 21).17 The nominal effective exchange rate depreciated in Portugal, Cyprus, and Spain, another comparatively small but positive factor in their favour. Country-specific trends benefited Irish and Portuguese exports, while Greece performed poorly, which could reflect uncertainty from fear of interruptions in the transport infrastructure harming the country’s attractiveness as a tourist location. Residual factors that are not explicitly explained in the analysis for Portugal could be the improvements in non-price competitiveness, reported by the OECD, the World Bank, and other institutions.18
Overall, the internal devaluation process is very demanding; it requires significant productivity improvements or, if needed, even cuts in income and structural macroeconomic adjustments that go beyond the regular three-year programme period.19 The euro area programme countries have so far realised marked improvements in their international competitiveness and the analysis suggests this has paid off. The countries should entrench these gains, rather than jeopardise them through slowing reform momentum in the post-programme period.
8 Spain’s programme was focused on financial sector recapitalisation, and therefore did not include explicit fiscal and structural conditionality. Instead, the Memorandum of Understanding foresees the regular monitoring of fiscal progress on exiting the Excessive Deficit Procedure and of structural reforms to correct macroeconomic imbalances identified within the framework of the European Semester.
9 As measured by the GDP deflator.
10 IC37 as defined by the European Commission: EU28 + nine other industrial countries: Australia, Canada, United States, Japan, Norway, New Zealand, Mexico, Switzerland, and Turkey.
11 Further details on the adjustment mechanisms in a monetary union can be found in IMF (2014), Adjustment in Euro Area Deficit Countries: Progress, Challenges, and Policies, SDN/14/7, pp. 10 et seqq.
12 Econometric analysis by the Bundesbank (2016) provides evidence of downward nominal wage rigidity in the euro area during the crisis period 2010 to 2013.
13 Further details on the policy measures of the financial assistance programmes can be found in ESM (2016), ESM 2015 Annual Report.
14 This report focuses on price competitiveness developments. The five programme countries also improved in non-price competitiveness, albeit in different areas. The OECD’s Product Market Regulation index and Employment Protection Legislation index as well as the World Bank’s doing business index overall suggest some improvements in Greece, Portugal, and Spain since the onset of the crisis. The European Innovation Scoreboard indicates improvements since 2013 only for Ireland and Portugal, and for Greece before 2014. The World Economic Forum’s Global Competitiveness Report overall records some improvements in Ireland, Portugal, and Spain since 2010.
15 Export performance growth is defined as the difference between export growth and the growth of export markets. See also European Commission (2017), European Economic Forecast Spring 2017, Institutional Paper 053.
16 Export performance, unit labour costs, and the nominal effective exchange rate (NEER) are calculated relative to 37 industrial countries. The horizon for Ireland refers to 2007–2014 to adjust for a break due to data revisions. Contributions to export performance are calculated based on the coefficients -0.53 for relative unit labour costs, -0.29 for NEER and on fixed effects (country-specific trend), stemming from a panel OLS regression with robust standard errors, explaining export performance growth through contemporaneous relative unit labour costs and NEER growth between 2000 and 2016 for the 12 countries that joined the euro area up until 2001, excluding Luxembourg. The regression has an R² of 16% and the coefficients are significant at a 1% level.
17 The French Treasury concludes that the geographical distribution of exports was an important driver of export market growth in Spain. This effect is partly taken into account in the panel analysis by considering unit labour cost developments relative to trading partners. (See Tresor Economics No. 140 November 2014 “Why are post-crisis Spanish exports so dynamic?”, Spanish firms facing a decrease in domestic demand have looked for new export markets and benefited from increased market share in growing countries).
18 See footnote 14.
19 See also the IMF’s conclusion in IMF (2015a), Crisis Program Review.