Safety measures concerning the Coronavirus COVID-19. Read more about the measures.

x
Return to landing
Chapter 1

The euro area in a volatile world: resilience under strain

Key takeaways

The euro area faces a volatile global environment, shaped by heightened geopolitical tensions and the ongoing global energy crisis. 

  • The economy enters this era with proven resilience, but it is not immune to external shocks: openness and energy dependencies leave it vulnerable and resilience is coming under strain.  
  • Under a baseline scenario (European Commission’s spring 2026 economic forecast), growth slows to 1.1% and inflation rises to 2.7% on average in 2026–2027, reflecting the impact of energy prices and a relatively swift normalisation of supply conditions.  

Two external risks dominate the outlook and could reinforce each other through real, confidence, and financial channels. 

  • Prolonged geopolitical tensions and re-escalation in the Middle East could intensify supply disruptions and energy price pressures, resulting in second-round effects and heightened uncertainty.  
  • An abrupt repricing of US assets amid high US policy uncertainty and stretched equity valuations would raise global risk aversion and tighten financing conditions. 

Financial vulnerabilities can act as amplifiers through cross-border financial exposures and changing market structures. 

  • The euro area financial sector’s large holdings of US assets and concerns about private credit markets could amplify market stress episodes.  
  • Sovereign bond markets are vulnerable to abrupt sentiment shifts, partly due to the growing share of more price-sensitive investors, including hedge funds. 
  • By contrast, firms, households, and banks remain relatively resilient at this stage. 

In an adverse scenario with prolonged geopolitical tensions and a sharp repricing of US assets, the euro area approaches recession while inflationary pressures intensify.  

  • Annual growth drops to 0.1% and inflation rises to 3.6% on average in 2026–2027. 
  • Over time, protracted high uncertainty and energy prices weigh on investment and competitiveness, leading to lasting output losses. 
  • Debt sustainability risks increase markedly, despite the immediate fiscal impact being relatively contained by the inflation surge. 

Credibility is critical for maintaining fiscal resilience. 

  • Large fiscal adjustment needs will have to be managed under the new EU fiscal framework, leaving little room for policy missteps. 
  • Efficient fiscal support only when needed, credible medium-term plans backed by clear priorities to ensure implementation are key to maintaining market trust and safeguarding fiscal resilience. 
1.1 Setting the scene: the euro area in a fracturing global order

This chapter assesses the main macro‑financial risks to the euro area and their implications for fiscal positions and sovereign debt markets. It focuses on a selection of risks that could materially affect the euro area’s economic outlook, the channels through which these shocks propagate across the real economy and financial markets, and how they translate into public finances and sovereign financing conditions. 

The global order that underpinned Europe's prosperity since the Second World War has changed. Multilateralism is under strain and economic relationships are increasingly shaped by geopolitical considerations. Adverse shocks are materialising more frequently than in the past: the Covid-19 pandemic, Russia’s invasion of Ukraine, rising tariffs from the United States (US), and the recent conflict in the Middle East, all occurring within a single decade. Episodes of market stress, although short-lived, are increasingly triggered by US policy actions, and responses across US asset classes have deviated from historical patterns. At the same time, advanced economies face high public debt, population ageing, and tepid long-term growth prospects, while transitions related to climate and technological change continue to shape the economic landscape.  

The euro area weathered recent shocks with notable resilience but is not immune to global headwinds. The recent conflict in the Middle East has triggered a significant global energy supply disruption – the second in less than five years – that is testing the euro area’s resilience anew. It has raised energy prices, weakened business confidence, tightened financial conditions, and impaired the outlook, increasing future downside risks (Figure 1.1).  

Figure 1.1

Shifts in euro area risk perceptions

Summary measure of survey-based risk perceptions in the euro area
(normalised index)

Notes: The graph shows the survey-based measure of asymmetric macroeconomic risk for the euro area based on Boni et al. (2026). Negative values indicate that risk perceptions are more tilted to the downside compared to their historical average since April 2003. Observations of the European Central Bank (ECB) Bank Lending Survey series for April and May 2026 are kept at their March (Q1) values.
Source: ESM calculations based on ECB, European Commission, S&P/HCOB, Sentix, and ZEW data

The baseline outlook for the euro area points to moderate growth and temporarily elevated inflation, but developments in the Middle East add significant uncertainty. Real gross domestic product (GDP) growth is projected at 1.1% on average in 2026–2027, while inflation is expected to rise to 3% in 2026 before easing gradually thereafter (European Commission, 2026). These projections rely on energy markets pricing a swift normalisation of supply conditions, a process that could be accelerated by the recent de-escalation in the region. However, the situation in the Middle East remains fluid, leaving baseline assumptions inherently fragile.  

Sovereign markets remain supportive, but fiscal buffers are thin in many countries. High public debt and deficits from past crisis support measures, coupled with higher defence and other spending pressures, leave limited room for manoeuvring new shocks. Market confidence has held up so far, but it cannot be taken for granted.  

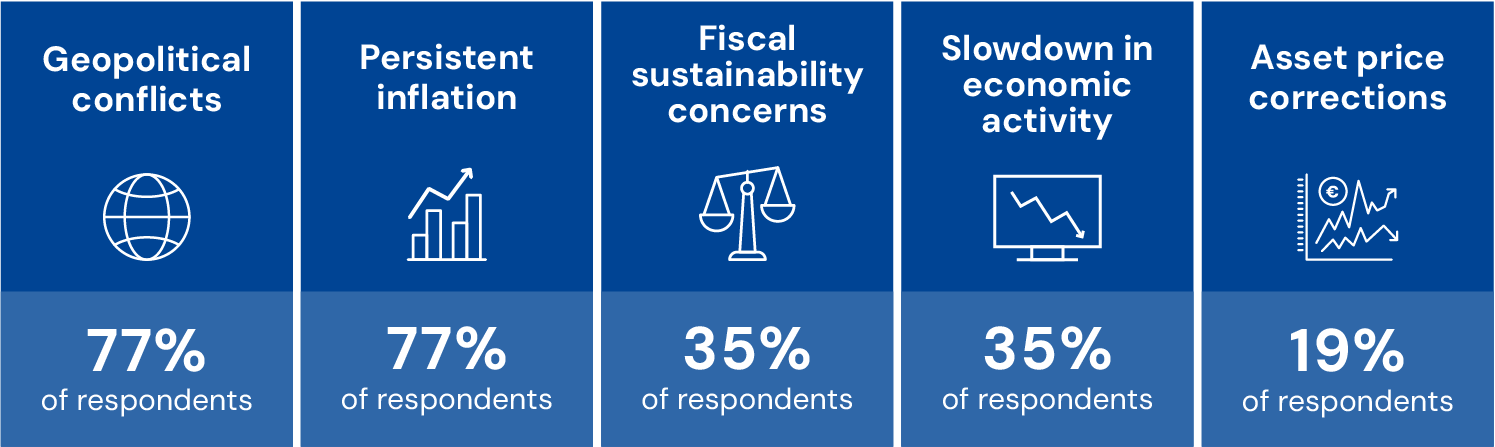
Survey-based evidence points to a risk environment dominated by geopolitical developments, inflation, and spillovers from global financial markets. The European Stability Mechanism (ESM) Sovereign Sentiment Survey (April 2026) shows that market participants view geopolitical tensions and persistent inflation as the main risks for euro area sovereign bond markets, followed by fiscal sustainability concerns and corrections in financial asset prices (Figure 1.2 and Box 1.5).  

This chapter sets out two main adverse risks and how they affect the euro area. Section 1.2 develops the selected risk narratives: a prolongation of geopolitical tensions, including a possible re-escalation in the Middle East, and an abrupt repricing of US financial assets. Section 1.3 examines vulnerabilities in private balance sheets and sovereign markets that could amplify their transmission. Section 1.4 quantifies the impact on the euro area under an adverse scenario. Section 1.5 assesses the fiscal implications for euro area countries. 

Figure 1.2

ESM Sovereign Sentiment Survey

Top five adverse risks for euro area sovereign bond markets over the next 12 months
(share of respondents, in %)
Figure1.2_cropped.png

Note: information in Box 1.5 and Annex A5
Source: ESM

Box 1.1

Which news moves euro area financial markets?

This box describes an approach to identifying and measuring the impact of market-moving news through a large language model. Geopolitical developments are shown to have material effects on markets, supporting the focus of this report’s risk narrative on geopolitics. The approach enables disentangling markets’ reactions to diverse types of news across a range of financial variables with methodological consistency and almost in real time.   


Extracting drivers of euro area markets from expert reports  

To identify market-moving news, a large language model is applied to the archive of the International Monetary Fund (IMF) daily Global Markets Monitor. The estimation covers the 2018–2026 period, with included news items grouped into five categories: global markets, macroeconomy, monetary policy, fiscal and structural policy, and conflicts and security. The extracted ‘news dummies’ enter a latent factor model (Gürkaynak et al., 2020) at daily frequency to quantify the news’ impact on the risk-free (German) yield curve and stock market volatility (VSTOXX), among other variables. In addition, the impact of macroeconomic data releases is considered. Further details are available in Annex A1

Financial markets’ reaction to geopolitical shocks

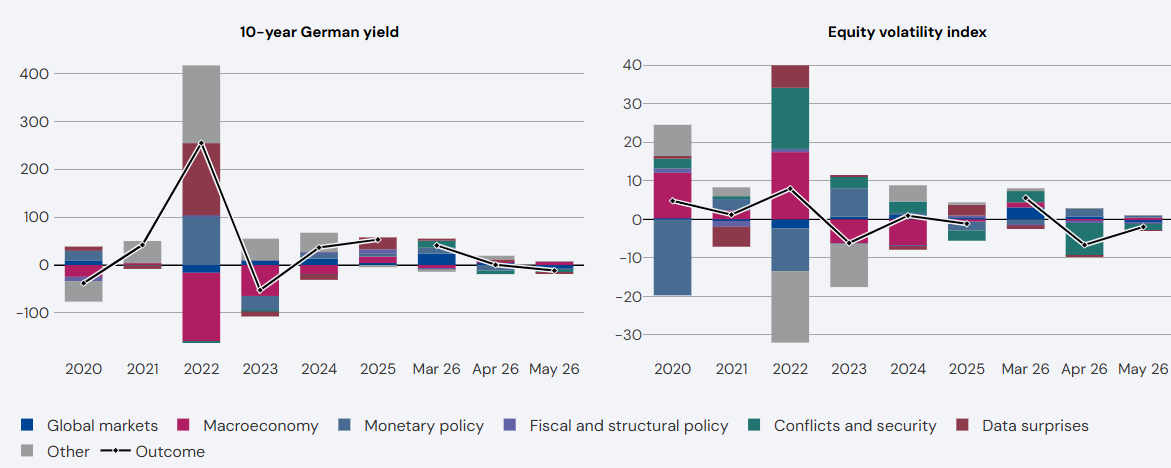
The war in the Middle East has caused turmoil in financial markets. When the US and Israel jointly launched airstrikes against Iran on 28 February 2026, financial markets were caught by surprise. Subsequent events, including the closure of the Strait of Hormuz and Iranian attacks on the energy infrastructure in surrounding countries, led to a sharp increase in volatility – especially in equity markets. Our approach largely attributes both the initial increase of the VSTOXX index in March and its subsequent reversal in April and May to war-related news, including its impact on global commodity markets, especially oil and natural gas (Figure B1.1.1, right panel). However, conflict-related news had less of an impact on equity volatility in March 2026 than it did at the onset of the Russian invasion of Ukraine in 2022.  

Euro area countries face increased borrowing costs as concerns about growth and inflation intensify. Since the end of February, euro area government bond yield curves have shifted upwards and flattened across countries, reflecting higher risk premia demanded by investors and expectations of rising interest rates. At the long end of the risk‑free yield curve, the breakdown shows that war‑related news, inflation fears linked to global energy price increases, and expectations of monetary policy tightening explain most of the upward shift in 10‑year German government bond interest rates observed in March (Figure B1.1.1, left panel), which only partly reversed by the end of May. 

The analysis confirms that different types of news drive long-term government bond yields and stock markets. Our breakdown shows that long-term yields are largely determined by monetary policy, through adjustments to the expected path of policy rates, data release surprises, and macroeconomic developments. News related to global markets and policy events plays a smaller role. However, large fiscal stimulus packages in Europe, such as the one approved in Germany in March 2025, can be linked to yield increases. By comparison, stock markets appear relatively more receptive to news regarding geopolitical conflicts, as well as news related to the broader macroeconomy. Monetary policy also impacted equities, often calming markets, as in 2020. 

Figure B1.1.1

Market-moving news in the euro area during turbulent times

Decomposition of changes in selected financial market variables
(left: in basis points, right: in percentage points)
The figure shows that bond yields and equity volatility in the euro area experienced large swings over the past years. Bond yields rose sharply in 2022 and fell the following year, while equity volatility spiked during crisis episodes. The sources of movements differ across both markets, with macroeconomic and monetary policy news mattering in both cases, while geopolitical news impact equity markets relatively more.

Notes: The figure shows the cumulative changes in the 10-year German government bond futures yield (in basis points), and the VSTOXX index (in percentage points) for the period 2020–2026 (cutoff date: 29 May 2026). Bars indicate the contributions of data release surprises and news extracted from the IMF’s daily Global Markets Monitor. ‘Other’ captures unexplained movements.
Source: ESM calculations based on Bloomberg and IMF data

1.2 Risks to the euro area outlook: geopolitical tensions and fragilities in US financial markets

This section sets out the main downside risks to the euro area outlook and the channels through which they could materially affect growth, inflation, and financial conditions. It focuses on two external risk narratives that are both plausible and potentially impactful in the current global environment: a prolongation of geopolitical tensions, including a re-escalation in the Middle East, and an abrupt repricing of US financial assets. While distinct in origin, these risks could reinforce each other, amplifying their macroeconomic and fiscal consequences for the euro area. 

1.2.1 Prolonged geopolitical tensions in the Middle East: Europe under pressure  

The recent military confrontation in the Middle East has returned geopolitics to the centre of the global macroeconomic outlook. The turmoil affected global energy markets, supply chains, and confidence. Accordingly, geopolitical risk indices rose significantly, reaching levels comparable to past episodes of acute geopolitical tensions (Figure 1.3). What distinguished the recent episode is not merely the severity of the immediate shock, but also the likelihood that elevated geopolitical risk would persist. The military intervention in Iran also raised security concerns across important maritime chokepoints and lowered the threshold for future confrontations elsewhere. 

Figure 1.3

Geopolitical risks on the rise

Energy and non-energy geopolitical risk indices
(standardised indices)

Notes: The geopolitical risk index is a news-based indicator constructed following Caldara and Iacoviello (2022). The energy and non-energy geopolitical risk are two variants of this index. The energy geopolitical risk restricts the underlying news articles to those that additionally refer to oil- or gas-related keywords, thereby capturing energy‑related geopolitical conflicts. The non‑energy geopolitical risk excludes such energy-specific terms.
Source: ESM calculations based on Factiva database (international news database produced by Dow Jones) data

The conflict is the most acute manifestation of a broader and more lasting shift in the global geopolitical environment affecting the euro area. The euro area faces several open fronts that could independently or jointly challenge its growth and financial stability: an unresolved war in Ukraine, structural uncertainty over the future of the North Atlantic Treaty Organization (NATO), continued tensions between major powers’ territorial ambitions, vulnerability at critical maritime chokepoints, and the renewed use of tariffs as geopolitical leverage.  

Current developments also highlight the euro area’s vulnerability to disruptions in global energy markets. The Strait of Hormuz, a chokepoint for a significant share of global oil and liquefied natural gas flows, stood at the centre of recent tensions. Direct exposure to the region is limited. Since the energy crisis of 2022, the euro area has also reduced its dependence on Russia as a single gas supplier and improved energy efficiency. But the move to liquefied natural gas and its overall strong energy import dependency leaves it structurally exposed to disruptions in global energy markets, with varying degrees of vulnerability across euro area countries (Figure 1.4). The Strait is also a critical route for fertilisers and industrial gases, broadening the potential impact of any supply shock, both globally and for the euro area. 

Figure 1.4

Euro area countries are highly exposed to rising energy prices

Energy imports, net
(in % of GDP, 2024)

Note: Energy imports are computed as net imports of oil and gas (imports minus exports), as share of GDP.
Source: ESM calculations based on United Nations Comtrade, World Bank, and IMF data

Prolonged geopolitical tensions and a possible re-escalation in the Middle East would raise energy prices and keep uncertainty elevated. While recent de-escalation efforts have eased immediate supply concerns and driven energy prices down, renewed tensions under fragile or non-binding ceasefire agreements, including further structural damage to energy infrastructure, could push prices up again. Elevated geopolitical tensions also raise uncertainty, as perceived threats weigh on activity as heavily as realised events (Caldara and Iacoviello, 2022). Planning and decision-making become more complicated for households, companies, and governments. Higher energy prices coupled with uncertainty affect the economy through several mutually reinforcing channels:  

  • Higher energy prices weaken real incomes and terms of trade. They reduce households’ purchasing power and consumption, while raising production costs and compressing firms’ profit margins. The resulting deterioration in the euro area’s terms of trade, reflecting its energy dependence, erodes firms’ competitiveness at a time when global trade costs are already on the rise.  
  • If higher energy costs feed into wage formation and price‑setting dynamics, inflation could remain elevated for longer. With the 2022 energy shock still fresh in memory and unemployment at historically low levels, workers may seek higher wages to offset real income losses. Firms facing squeezed margins may attempt to pass higher labour costs on to consumers if demand remains sufficiently resilient. 
  • Uncertainty weighs on confidence and delays investment. Persistent geopolitical tensions and supply disruptions increase uncertainty. High uncertainty weighs on consumer and business confidence, encouraging precautionary behaviour and delaying investment decisions.  
  • Financial conditions tighten as risk appetite deteriorates. When geopolitical tensions and economic uncertainty intensify, investors demand greater compensation for risk, equity valuations fall, and volatility across asset classes rises. This channel was already activated in the immediate aftermath of the initial US-Israel intervention in Iran (Box 1.1). Tighter financing conditions amplify the impact of the other channels, particularly on investment. 

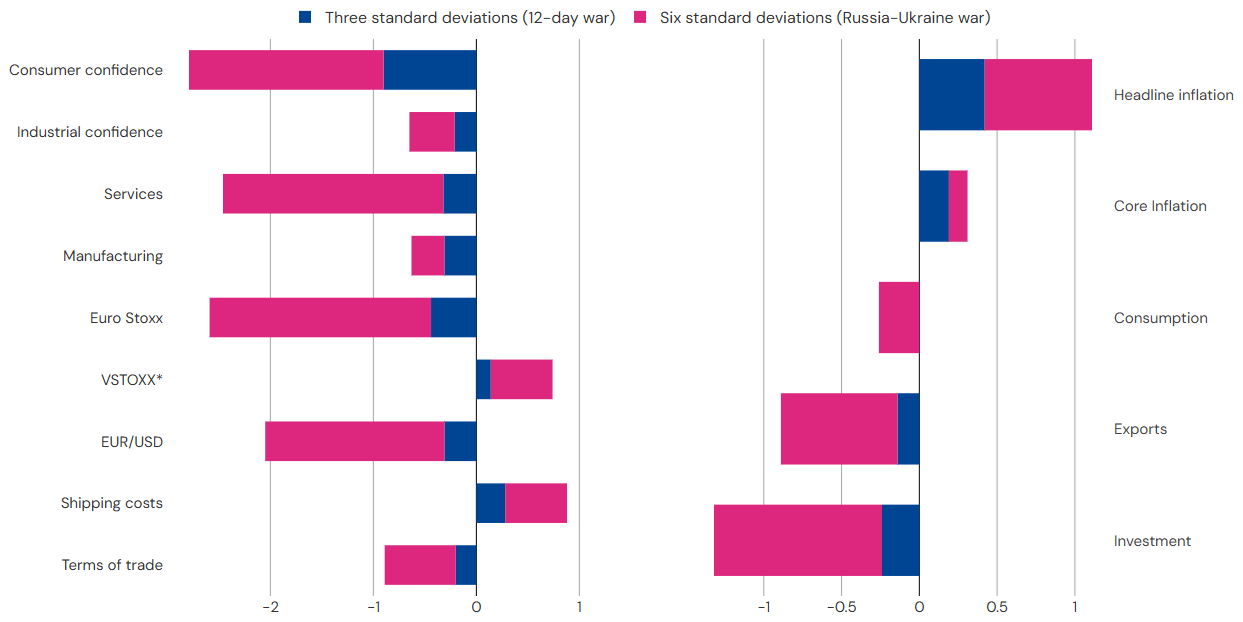
More broadly, an environment with high geopolitical tensions may generate non-linear economic dynamics. 1 Higher energy prices and greater uncertainty can tighten financial conditions and increase macroeconomic damage non-linearly. Investment and exports would be disproportionately affected. A simulation comparing two recent episodes of geopolitical shocks shows that doubling the size of the shock is associated with a sixfold decline in investment and a sevenfold reduction in exports (Figure 1.5). These non-linearities are a key feature of the adverse scenario (Section 1.4).

Over the longer term, persistently higher energy costs and uncertainty weaken competitiveness, productivity, and, ultimately, long-term output. High energy prices sustained over time further erode the competitiveness of European manufacturers. In addition, elevated uncertainty acts as a persistent drag on investment, as firms delay or reconsider their plans. This is particularly detrimental for the euro area at a time of high and rising investment needs related to defence, the green transition, and digitalisation. 

  • 1

    See Capolongo et al. (forthcoming) for the euro area and Brignone et al. (2025) for the US

Figure 1.5

Escalating geopolitical tensions and energy prices impact the euro area through multiple channels, with non-linear effects

Channels of transmission and non-linear impact on real economy and prices
(deviations from baseline)
Two‑panel bar chart illustrating the impact of a further escalation in geopolitical risks and energy prices relative to a baseline scenario. Panel A shows channels of transmission, including consumer and industrial confidence, PMIs, financial market volatility, equity prices, exchange rates, shipping costs, and terms of trade. Negative effects dominate, with larger declines under a stronger shock. Panel B shows macroeconomic impacts, with reductions in consumption, investment, exports, and imports, alongsid

Notes: The results of this exercise are based on a factor-augmented vector autoregression. Shocks of three and six standard deviations broadly correspond to the increase in the geopolitical risk index observed during the war between Iran and Israel (12-day war) in June 2025 and the start of the Russian invasion of Ukraine, respectively. Left-hand panel reports level differences for the S&P Global Purchasing Managers’ Index for manufacturing and services, confidence indicators from the European Commission’s Business and Consumers surveys, and equity market volatility (VSTOXX). It captures percentage deviations from the baseline at the end of one quarter of shipping costs (proxied by the Baltic Dry, a shipping freight-cost index), EUR/USD, and euro area equity market index (EURO STOXX). For readability, the VSTOXX and Baltic dry responses are scaled by a factor of 10. Right-hand panel shows deviations from the baseline of quarter-on-quarter growth rates for the first quarter for GDP components and average year-on-year growth rates for inflation (harmonised index of consumer prices) and core inflation (harmonised index of consumer prices excluding energy and food).
Sources: ESM calculations based on Eurostat, European Commission, and Bloomberg data

1.2.2 Sharp US asset price correction spilling over to the euro area

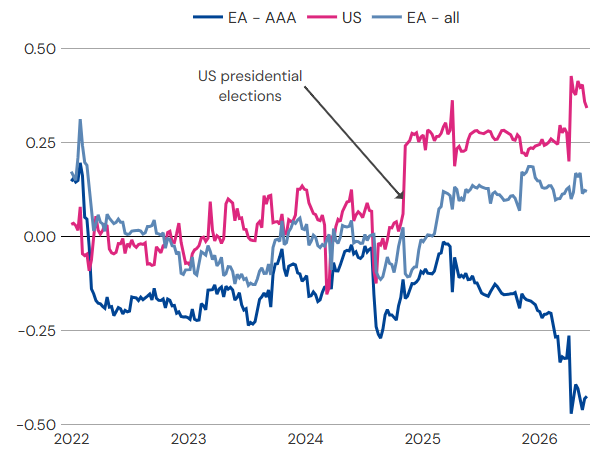
Global investor perceptions of US government bonds are shifting. US policies, including tariffs and military interventions, are increasingly triggering episodes of market stress. As a result, asset price reactions have diverged from historical patterns.2 Recent spikes in market volatility have been accompanied by a widening risk premium on long-term US Treasuries (Figure 1.6a). Foreign outflows from US government bond markets in periods of acute market stress are not unprecedented, but in the past, they typically reflected the liquidity of US Treasuries rather than a weakening of their safe-haven status (Box 1.2). 

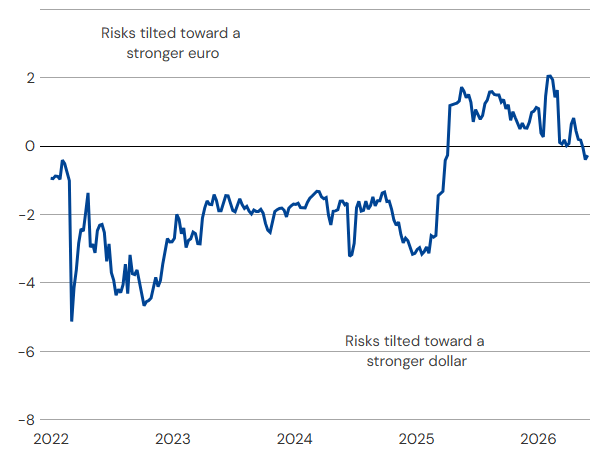
In addition, there are signs of a structural decline in investor confidence in the US dollar’s performance during market turmoil. As diversification benefits from US dollar exposure have declined, foreign investors in US assets have increased their exchange rate hedging. Weakened US dollar sentiment can be seen in options pricing. Contrary to the historical pattern, the medium-term cost of hedging against significant US dollar depreciation is now comparable to the cost of hedging against the opposite change (Figure 1.6b). At the same time, many reserve managers intend to diversify away from the US dollar.3

Investor confidence in US assets could weaken if domestic developments prompt a reassessment of US policy credibility or elevated equity valuations.
Three channels appear particularly relevant: 

  • Concerns about US fiscal dynamics could crystallise in response to domestic political developments. The federal and general government deficits relative to GDP are projected to remain around 6% and 7.5%, respectively, in the coming years.4 Rising interest payments, higher military spending, and potential fiscal support ahead of the midterm elections later this year are adding upside risks. A broader investor reassessment of US fiscal sustainability could materially raise US Treasury yields.  
  • Concerns about US Federal Reserve independence could deepen cracks in the safe-haven status of US Treasuries and the US dollar. Since 2025, political pressure on the US Federal Reserve has pushed investors to question the durability of its inflation mandate. Should doubts about central bank independence intensify again, particularly if inflation rises while the Federal Reserve is perceived as constrained, investor confidence in US Treasury holdings may falter, leading to higher long-term interest rates and potentially a depreciation of the US dollar. 
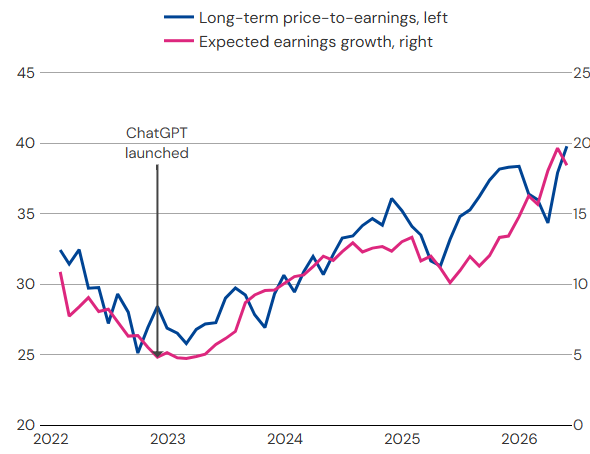
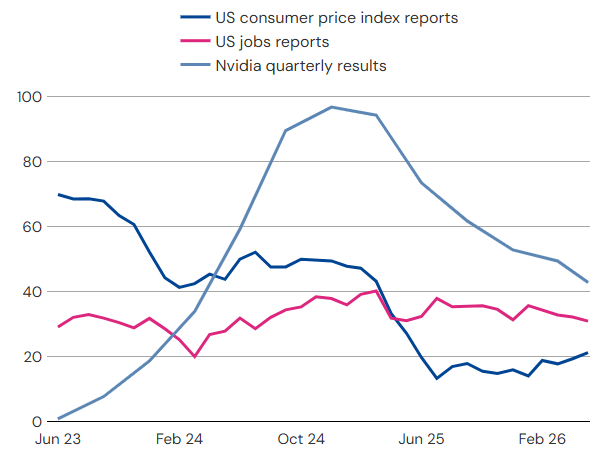
  • Stretched US equity valuations could adjust abruptly, if optimism around artificial intelligence (AI) investments dwindles. Expectations of exceptional AI-driven earnings growth have contributed to rising equity valuations (Figure 1.7a). Capital expenditure by the largest US firms on AI infrastructure has been substantial, and AI-related news is seen as more market-moving than conventional macroeconomic data releases (Figure 1.7b). However, the ultimate returns on AI investments remain uncertain, especially given growing competition in developing this technology. Hence, the assumption that large technology firms’ profits will continue to offset broader market pressures could be challenged.5If earnings expectations are revised downward, prices would correct sharply and broader market volatility would soar, reflecting heightened concentration.
  • 2

    Jančoková et al. (2026).

  • 3

    Official Monetary and Financial Institutions Forum (2026).

  • 4

    Congressional Budget Office (2026), International Monetary Fund (2026a).

  • 5

    This assumption is currently reflected in the low implied correlation of individual stock performance. See Goosen et al. (2024

Figure 1.6

US policies are increasing the risk premium in US Treasuries and eroding the safe-haven status of the US dollar

a)
Correlations between market stress and risk premium in government bonds
(correlation coefficient)
Panel a: A time-series from 01/01/2022 to 27/03/2026 showing rolling correlations between the VIX and measures of government-bond risk premia. Since the US presidential elections in late 2024, the correlation turns strongly positive for the US at stays around 0.3. For the euro area - AAA, in turn, it gradually declines to historical low below -0.3.
b)
Investor perception of the balance of tail risks to EUR/USD exchange rate
(in percentage points of implied volatility)
Panel b: A time-series from 01/01/2022 to 27/03/2026 showing the pricing of an out-of-the-money EUR/USD risk-reversal strategy. The trends show that while for the short-term (1M) the risks tilted toward a stronger dollar in response to the conflict in the Middle East, but for a long-term (1Y), risks are tilted toward a stronger euro, a structural shift since early 2025.

Notes: Panel a) shows the 52-week rolling correlation coefficient of weekly changes in the volatility index and in spreads between 10-year government bond yields and overnight index swap rates: ESTR (euro area) and SOFR (US). The two groups shown for euro area government bonds (only AAA-rated bonds and all bonds) are based on ECB methodology. EA stands for euro area. Panel b) shows the pricing of risk reversals calculated as the difference between implied volatility in 10% delta call options and 10% delta put options on the EUR/USD exchange rate.
Source: ESM calculations based on Bloomberg and ECB data

A financial shock originating in US asset markets would transmit to the euro area through a combination of channels: 

  • Falling US asset prices would rapidly and directly reduce investors’ wealth and tighten financial conditions in the euro area. The euro area has large and increasing holdings of US portfolio investments. At end-2025, the US accounted for nearly half of the euro area’s total global portfolio holdings – 59% of equity positions and 36% of debt, compared with roughly one-third in 2013. Measured against euro area GDP, this exposure reached 46% in 2025, up from 18% in 2013. Therefore, a material repricing of US assets would bring substantial direct losses for European investors. It would also lead to higher global risk aversion, with investors requiring higher risk premia across different asset classes and jurisdictions, tightening financial conditions in the euro area as well.  
  • The spillover to financial markets may be asymmetric across euro area sovereigns. Capital reallocation away from US Treasuries could compress yields on higher-rated euro area sovereign bonds (Figure 1.6a), offering a partial offset to tighter financial conditions.6 However, sovereign bond spreads may widen for lower-rated sovereigns. Over the short term, a weakening of the US dollar could erode euro area export competitiveness. Over the longer term, a more structural shift away from global US dollar dominance could strengthen the international role of the euro, benefitting the safest euro area assets.   
  • A correction in US equity prices would also affect the US economy, with spillovers to Europe. US equity market capitalisation now stands above 230% of GDP (compared to 150% in 2000), and equities account for around 33% of US household wealth (compared to 26% in 2000). While the concentration of equity ownership among more affluent consumers has increased in recent years, so has the concentration of consumption (the “K-shaped economy”). In addition, a high share of AI-related capital expenditure could lead to a more abrupt decline in investment. Therefore, the overall wealth and investment effects of a significant correction could be larger and more consequential than in previous episodes. A slowdown in US growth would spill over to the euro area through weaker external demand.  
  • 6

    See Cornevin and Peppel-Srebrny (2026).

Figure 1.7

US equity valuations rely on AI-driven earnings growth expectations

a)
US equity valuation metrics and earnings growth expectations
(ratio, in %)
Panel a: A scatter plot comparing long-term price-to-earnings ratios (y-axis) alongside annualised two-year expected earnings growth (x-axis) since ChatGPT launch until Q1 2026 with a strong correlation between them. For the US equity market both metrics increase by much more than the euro area. At the latest date, the euro area is roughly 24.0 with 11.7% expected growth, and the United States is roughly 34.7 with 16.5% expected growth.
b)
Relative increase in market volatility implied for key data publications
(in %)
Panel b: A time-series from June 2023 to March 2026 showing the relative increase in implied market volatility around three US information releases: CPI reports, jobs reports, and Nvidia quarterly results, with the last becoming the highest of them since mid 2024, while CPI reports gradually declining in relevance since 2023.

Notes: Panel a) shows monthly data for the price-to-earnings ratio based on 10-year average real earnings and annualised two-year blended-forward expectations for earnings-per-share growth for the S&P 500. Panel b) shows the 12-month average increase in implied volatility for the S&P 500 on reaction days to key data publications relative to the day before, based on the CBOE 1-Day Volatility Index.
Source: ESM calculations based on Bloomberg data

Box 1.2

Sovereign bond flows amid geopolitical risk and market volatility

This box takes a historical perspective on foreign investors’ inflows into euro area and US government securities during periods of geopolitical and financial stress. International investors play a sizeable role in the world’s two largest sovereign debt markets, holding about a third of US Treasuries and a quarter of euro area debt. More recently, foreign demand for government bonds has come under closer scrutiny. Recent subdued inflows or selloffs in the US have prompted questions about its safe‑haven status. In the euro area, the focus has shifted to renewed foreign participation amid the ECB’s quantitative tightening. This box takes a step back to assess, from a long-term perspective, how foreign-investor demand for sovereigns has typically responded to global stress, abstracting from price dynamics and broader considerations about the global role of the US dollar and euro.7

US Treasuries attract flight-to-safety inflows, which weaken when their global liquidity role prevails, while the euro area remains resilient during times of stress. Conventional wisdom suggests high uncertainty drives reallocation from riskier to safer assets, particularly into US sovereign markets. However, the evidence in this box indicates that foreign safe-haven inflows into US Treasuries can be state-dependent, especially in times of geopolitical tensions. As a cornerstone of the global financial system, US Treasuries also provide global liquidity which, in periods of acute stress, can dominate flight-to-safety flows and lead to foreign outflows. Euro area government securities do not display the same dual role. They nevertheless exhibit strong resilience during periods of both geopolitical and financial stress, anchoring foreign demand within the region by serving as a stable store of value. 

Episodes of extreme geopolitical risk dampen foreign inflows to US government bonds, while the euro area sees no material shift. In response to geopolitical risk shocks, US Treasuries attract persistent inflows, largely from non‑euro area investors, consistent with a flight-to-safety behaviour (Figure B1.2.1). However, this pattern weakens when geopolitical tensions become particularly acute. Foreign inflows turn muted, potentially reflecting investors’ ‘wait and see’ stance, a retrenchment towards home markets, or increased demand for liquidity. This pattern points to a state-dependent foreign demand for US bonds that peaks under moderate geopolitical stress.8 By contrast, euro area sovereign bond markets remain broadly stable across both types of episodes, with neither notable inflows nor outflows. Even without a clear reallocation towards the region, the absence of systematic outflows points to resilient foreign demand and suggests that euro area sovereigns retain hedging value during geopolitical stress rather than being a source of vulnerability.9

  • 7

    The analysis extends beyond financial market volatility to geopolitical risk events, which can amplify global uncertainty and trigger cross-border portfolio reallocations (Hudecz et al., 2024; Lauwers et al., forthcoming).

  • 8Interestingly, when extreme geopolitical tensions are closely linked to the euro area, foreign demand for US sovereigns reasserts itself. These supplementary results are reported in the accompanying Annex A2, together with details on the data and methodology.
  • 9

    In line with the findings in this box, Treasury International Capital data for March 2026 point to muted foreign flows into US sovereign securities, as private safe-haven inflows were offset by official outflows—notably from oil-importing economies facing increased US dollar liquidity needs. By contrast, euro area sovereigns recorded foreign inflows.

Figure B1.2.1

Sovereign flows show nuanced dynamics under geopolitical stress

Cumulative foreign inflows to sovereign bonds after global geopolitical risks
(in % of annual GDP)

Notes: Cumulative impulse responses following a one standard deviation shock in global geopolitical risk based on local projections estimated over M1 1999–M12 2024. The pink line shows the response during months associated with major geopolitical events (>90th percentile, 32 episodes), the blue line otherwise. Shaded areas show 68% confidence intervals based on Newey-West standard errors with 12 lags.
Sources: ESM calculations based on ECB balance of payments data and US Treasury International Capital data, valuation adjusted following Bertaut and Tryon (2007), Bertaut and Judson (2014, 2022), and Caldara and Iacoviello's (2022) geopolitical risk data

Euro area sovereign bonds not only withstand geopolitical shocks but also anchor foreign investment within the region during broader risk-off episodes. During periods of elevated financial market volatility, captured by volatility index (VIX) spikes, foreign investors tend to reallocate portfolios within the euro area rather than move away from it. They reduce exposure to euro area equities and shift into safer, liquid short-term sovereigns (notably German and French bills). These securities attract persistent inflows, reflecting their role as stable store of value assets (Figure B1.2.2, left panel). By contrast, longer dated bonds exhibit muted flows owing to higher duration risk, but do not see outflows. 

The US provides global liquidity insurance in periods of market turmoil. In contrast to the euro area, US long-term government bonds face large foreign outflows following volatility index spikes (Figure B1.2.2, right panel). While this contradicts the conventional ‘flight to Treasuries’ narrative, it does not necessarily imply an erosion of their safe-haven status. Instead, consistent with recent studies, foreign private and official investors may unwind longer-dated Treasuries to obtain cash dollar liquidity during market turmoil, taking advantage of Treasuries’ superior liquidity and their absorption by US domestic investors (Chaudhary et al., 2025). In line with this mechanism, shorter-term instruments attract foreign inflows. This liquidity channel is more likely to dominate during volatility index spikes, when funding stress, margin calls, and deleveraging among private investors intensify (known as a ‘dash for cash’).10

  • 10

    Despite large shifts during the Covid-19 pandemic, results remain qualitatively similar when this period is excluded.

Figure B1.2.2

Foreign flows under market stress: the roles of euro area and US assets

Cumulative foreign inflows during acute financial market volatility
(in % of annual GDP)

Notes: Cumulative impulse responses, with 68% confidence intervals, to a one standard deviation in the volatility index (US stock-market VIX), in months when the index is above the 90th percentile.
Source: ESM calculations

Overall, geopolitical and financial turbulence affect US and euro area sovereign markets differently, reflecting the distinct roles of these markets. Moreover, the results point to a resilient international role of euro area sovereign markets during these episodes. Future work could explore how transmission channels differ between volatility index and geopolitical risk shocks and extend the analysis to domestic investors and price dynamics. 

1.3 Financial vulnerabilities as amplifiers of external shocks

This section examines how existing financial vulnerabilities could heighten the impact of the downside risks described in Section 1.2. It focuses on vulnerabilities in private-sector balance sheets, including financial intermediaries, and in euro area sovereign bond markets that could amplify the transmission of external shocks to the real economy. While firms, households, and banks are entering this period with buffers, rising uncertainty and tighter financial conditions could test the resilience of parts of the non-bank financial sector and of sovereign markets given the growing share of price-sensitive investors. 

1.3.1 Corporates, households, and banks have financial buffers

Households enter this period with meaningful financial buffers, although unevenly distributed. Households appear broadly resilient, supported by accumulated savings, robust income growth, and historically low debt-servicing burdens. However, rising energy prices, elevated uncertainty, and tighter financial conditions weaken real incomes, while wealth and confidence effects likely reinforce precautionary savings and weigh on consumption. Low-income households are particularly vulnerable, reflecting more limited savings and a higher share of energy expenditure. 

Firms have benefitted from strong nominal profit growth in recent years and retain solid fundamentals overall,11 but financial pressures are mounting. Higher energy costs compress margins while weaker demand can limit firms’ ability to pass on increased production costs. This contrasts with the 2022 energy shock, when strong demand and extensive fiscal support sustained firms’ pricing power. Elevated uncertainty and tighter bank credit standards further weigh on firms’ debt-servicing capacity and investment decisions, encouraging firms to postpone capital expenditure and scale back production. Energy-intensive and demand-sensitive sectors, such as manufacturing of household goods, automobiles, and machinery, are particularly vulnerable to these conditions. 

Banks’ risk aversion appears to be on the rise, despite solid financial positions and limited direct exposure to US assets. Capital and liquidity positions are sufficient to absorb the effects of the two external risks considered in this chapter. Banks’ direct exposure to US assets is modest overall: US credit risk accounts for about 4.9% of total credit risk, while holdings of US government securities amount to roughly 1.2% of total assets. However, when geopolitical risks intensify, banks tend to rebalance portfolios towards sovereign bonds and away from private-sector lending. A prolonged energy shock combined with heightened risk aversion could therefore constrain credit supply, particularly to energy-intensive sectors (Box 1.3). The impact would likely be uneven across countries, reflecting differences in banks’ exposures to the shock (Figure 1.8) and in non-performing loan ratios in the most affected sectors. 

  • 11

    On aggregate, non-financial corporations’ debt service ratio (interest payments over gross operating surplus) is stable at 7.8% and consolidated debt declined to 65.6% of GDP in Q4 2025.

Figure 1.8

Euro area banks’ vulnerabilities to an energy price shock

Share of lending to non-financial corporations and non-performing loan ratio
(% of total lending and % of non-performing loan in the segment)

Notes: Data as of Q4 2025. Loans to mining and quarrying (NACE B), manufacturing (NACE C), water supply, sewage, waste management, and remediation activities (NACE E), and transportation and storage (NACE H) are classified as energy intensive.
Sources: ESM calculations based on European Banking Authority data

1.3.2 The non-bank financial sector could amplify market stress

Non-bank financial institutions have substantial US exposures. Insurers and occupational pension funds together have about €710 billion in US exposures (7% of invested assets) on their balance sheets, mostly in US equities and corporate bonds. Euro area bond and money market funds have invested around €1 trillion in US issued bonds, about 37% of which (or 4% of total net asset value) are US government bonds.12Asset price corrections in the US combined with negative market sentiment would cause losses for insurers and pensions. For funds, redemption shocks could trigger large asset sales, exacerbating negative asset price dynamics in a volatile market and potentially spilling over to other markets and asset classes. Illiquid investment fund portfolios could amplify these effects.

Euro area equity funds are particularly exposed to US equity markets. Assets under management of euro area equity funds have increased more than sevenfold since 2009, reaching €6.1 trillion by end-2025, while the share invested in US assets has risen from 19% to almost 45% (Figure 1.9a). Given the significant exposure, a correction in equity prices would have a meaningful impact and generate substantial losses for the sector. Illustratively, a 25% correction in US equity prices could reduce euro area equity fund net asset values by around 14%. Losses would arise not only through direct valuation effects on US holdings, but also from spillovers to European equity markets, and additional losses on unhedged dollar positions could materialise if the US dollar does not appreciate. A correction comparable to those that occurred during the Covid-19 pandemic or the global financial crisis, would have substantially larger effects (Figure 1.9b).13 Losses would transmit to the real economy through negative household wealth effects, higher equity financing costs for firms, and declining collateral values, leading to tighter bank lending conditions. 

  • 12

    Non-bank financial institutions partially hedge their currency exposure through FX derivatives. Data indicate that hedging increases when the dollar depreciates and vice versa and generally tends to be higher for fixed income assets than equities.

  • 13

    For comparison, the US equity price fall during the global financial crisis was almost 57%.

Figure 1.9

Greater US equity exposure increases spillover risks for euro area funds

a)
Euro area equity funds’ holdings by geography
(in € billion)
b)
Estimated losses of equity funds under different corrections in US equity prices
(in % of net asset value)

Notes: Panel a) shows euro area equity funds’ holdings by geography, where other equity refers to extra-euro area equity excluding US equity. EA stands for euro area. Panel b) shows model-based losses as a percentage of net asset value under selected historical and a stylised stress scenario, assuming a 25% FX hedge ratio.
Source: ESM calculations based on ECB data

The rapid expansion of opaque private credit markets, and the leverage increasingly embedded within them, represents a further vulnerability. Limited data availability hampers quantification and may obscure correlations with public markets, complicating risk assessment. Liquidity mismatches in private credit funds that allow for redemption (primarily a US phenomenon) could trigger withdrawal pressures that exceed available liquid assets. Measures have been designed to mitigate this pressure, such as liquidity gates or swing pricing. Nevertheless, under extreme stress conditions, such measures may amplify rather than contain investors’ reaction.  

Growing interdependencies between funds and banks increase banks’ exposure to potential liquidity stress in the fund sector. Global investment funds held around €450 billion of euro area banks’ long-term debt in 2025 (10% of total outstanding), about a fifth of which was provided by asset managers affiliated with euro area banks (Figure 1.10). These close linkages increase banks’ exposure to potential liquidity stress in the fund sector, which could disrupt funding conditions and force the sale of bank bonds, creating rollover and regulatory pressures.14 The widespread bank ownership of euro area funds raises additional step-in risk should parent banks need to support distressed affiliates.

  • 14

    Long-term bank debt is required to comply with loss absorption and stable funding regulatory requirements.

Figure 1.10

Bank funding is becoming more intertwined with the fund sector

Bank debt held by investment funds, by fund domicile
(in € billion)

Notes: Values based on market value. Euro area bank-affiliated fund refers to euro area domiciled funds that are ultimately owned by a euro area bank. Banks’ long-term debt includes Additional Tier 1 bonds, Tier 2 bonds, corporate bonds, covered bonds, and securitisation bonds. Latest available data June 2025.
Source: ESM calculation based on Lipper data

Box 1.3

Banks’ sovereign exposures and credit supply under a new geopolitical regime

This box assesses banks’ propensity to lend amid elevated geopolitical uncertainty, and the role played by their sovereign exposures. Using data from the European Banking Authority’s annual transparency exercise, this box examines how the extent of banks’ sovereign exposures affects their ability to provide credit to the real economy. The analysis compares the geopolitical regimes of pre- and post-Russia’s invasion of Ukraine in 2022, zooming in on differences in bank lending to energy- and non-energy-intensive sectors. 

Euro area banks are navigating a new geopolitical regime

The Russian invasion of Ukraine marked the beginning of a new geopolitical regime. Since the start of the war in Ukraine, geopolitical risk has remained persistently elevated compared to the period preceding the invasion (Figure 1.2), contributing to a more uncertain macro-financial environment. 

The new geopolitical regime has been associated with higher bank risk aversion and rising sovereign exposures. In general, when risk aversion rises, sovereign investments are perceived as offering more attractive risk-adjusted returns than other, riskier alternatives. Since late 2022, sovereign exposures have steadily grown in banks’ balance sheets, partly also driven by the growing supply of government bonds and the ECB’s quantitative tightening, though with significant variance across institutions. Over the same period, lending to the private sector has been subdued (European Systemic Risk Board, 2026). These developments raise the concern that sovereign exposures may crowd out banks’ lending to the real economy.  

Findings suggest that since 2022, banks’ sovereign exposures have dampened lending, particularly to energy-intensive firms. The geopolitical shift is associated with a lower level of lending to the private sector, particularly among banks with larger sovereign exposures, which see a stronger slowdown in credit growth. 

Credit dynamics diverge markedly across sectors and depend on the level of sovereign exposures (Figure B1.3.1). Since 2022, banks with low sovereign exposures show no meaningful sectoral differences in credit dynamics over an eight-quarter horizon (Figure B1.3.1, left plot). By contrast, banks with a median level of sovereign exposures display lower lending to energy-intensive firms, with a difference of up to four percentage points compared to other sectors after five quarters (Figure B1.3.1, centre plot). The gap in credit dynamics between sectors is wider for banks with higher sovereign exposure (Figure B1.3.1, right plot). While the effect gradually fades after two years for banks with low and median levels of sovereign exposures, it remains more pronounced for banks with high sovereign holdings. 

Results suggest that higher bank risk aversion, amid elevated geopolitical uncertainty, reinforced bank-sovereign linkages and weakened lending. Higher shares of sovereign exposures are associated with lower levels of riskier lending since 2022. While the observed greater geographical diversification of sovereign portfolios mitigates concentration risk (Figure 1.12b), a larger share of balance sheets invested in sovereigns nonetheless implies fewer resources channelled to the real economy. In the context of the renewed energy shock triggered by the latest conflict in the Middle East, an analogous shift in banks’ risk appetite and portfolio composition would weigh on banks’ intermediation capacity and dampen credit provision to the real economy, especially to those sectors which might need it most.  

Figure B1.3.1

Sovereign exposures shape sectoral bank lending

Marginal effects of sovereign exposures on lending to energy- versus non-energy-intensive sectors after Russia’s invasion of Ukraine
(in percentage points)

Notes: The graphs show the cumulative impulse response functions of lending to energy- and non-energy-intensive sectors following the Russian invasion of Ukraine, with confidence intervals at 90%. Results are reported conditional on different percentiles of sovereign exposures' holdings (Low=25th, Median=50th, and High=75th percentiles). Energy-intensive loans include manufacturing, transport, mining, and water supply (NACE codes B, C, E, and H), following the European Systemic Risk Board (2026) classification. Results obtained using panel local projection estimated over Q4 2019–Q2 2025, where credit growth rates are regressed on a set of macro-financial and global regressors and an interaction term between the ratio of sovereign exposures to total assets and a dummy variable that takes the value of 1 the quarters following the start of Russia’s invasion of Ukraine. See Annex A3 for details on the methodology.
Source: ESM calculations


1.3.3. Sovereign markets: benign pricing of sovereign risks and changing investor landscape exposes bonds to price corrections

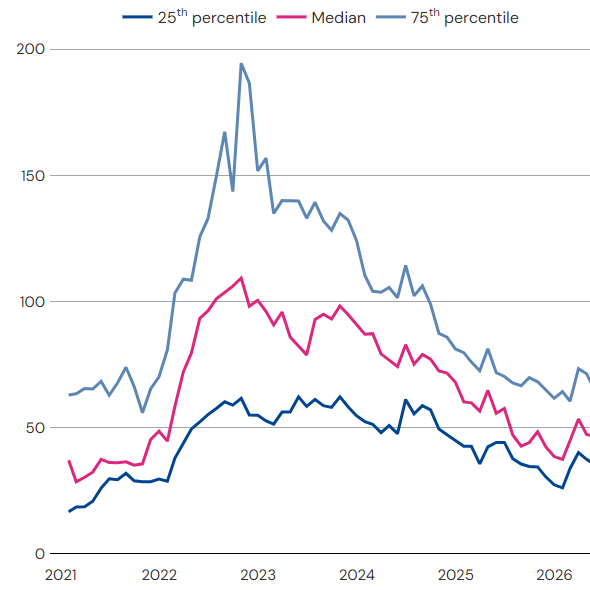
Sovereign spreads in the euro area continue to reflect benign market pricing of risks. Between late 2023 and early 2026, euro area sovereign spreads compressed, supported by declining interest rate uncertainty (among other factors), and the dispersion of spreads declined (Figure 1.11a). Recently, sovereign spreads have widened somewhat in response to the conflict in the Middle East, but on average remain contained by historical standards. 

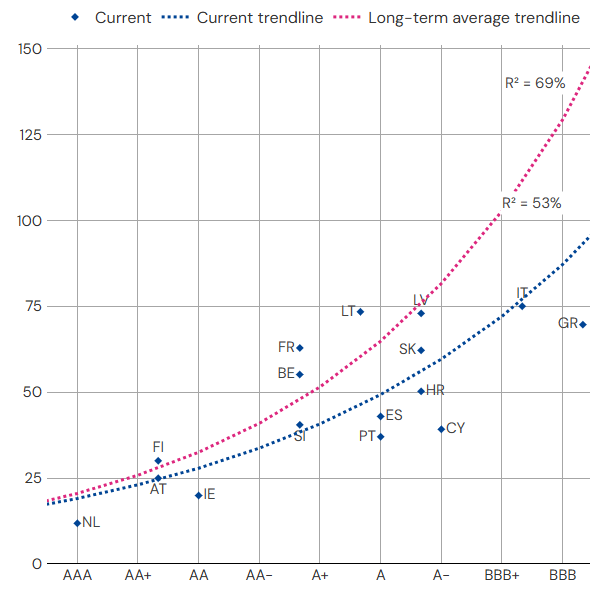
Relatively compressed spreads suggest that investors trust the euro area institutional framework. The additional risk premium required by investors for purchasing riskier euro area sovereign debt has fallen below historical averages (Figure 1.11b). This partially reflects progress in fiscal adjustment by some countries, particularly former ESM beneficiary Member States (Section 1.5).15 On aggregate, the compression of spreads outpaced the improvement in underlying fiscal fundamentals. This indicates investor trust in euro area backstop mechanisms, as also confirmed by market participants (see Box 1.5).

An adverse global risk environment, signs of weakening political cohesion in the EU or deteriorating fiscal fundamentals could prompt investors to reassess sovereign risks. Risk premia could re-align with historical patterns. To sustain the current benign view, compliance with the fiscal framework as a guardrail to fiscal sustainability is essential. The ECB’s Transmission Protection Instrument reduces market-driven fragmentation risk but is not designed to insulate sovereigns from spread widening related to country-specific economic imbalances.16ESM support provides a safety net that includes precautionary instruments, but it serves to safeguard financial stability – rather than as a substitute for healthy public finances. Investor trust in the European institutional framework should not be taken for granted. The more market participants doubt countries’ budgetary sustainability and resilience, the more likely sovereign bond spreads are to widen again, potentially triggering financial instability. 

The greater role of more price-sensitive investors, including hedge funds, makes euro area sovereigns more vulnerable to changes in global risk sentiment. Amid ongoing ECB balance sheet normalisation and elevated US policy uncertainty, the footprint of non-euro area investors, including hedge funds, has increased substantially (Figure 1.12a).17 Box 1.4 shows that in countries where these investors hold a high share of sovereign debt, negative demand shocks can meaningfully widen spreads.  

  • 15

    See Gnewuch (2026).

  • 16

    See ECB (2022).

  • 17

    Hedge funds active in the euro area government bond market are mostly domiciled outside the euro area and now account for over half of electronic trading volumes (up from around a quarter in 2018). See ECB (2025). 

Figure 1.11

Sovereign bond spreads appear compressed relative to historical standards and fundamentals

a)
Distribution of euro area sovereign spreads
(in basis points)
Panel a: A two-line time-series showing the average deviation of euro area sovereign spreads from their 10-year moving average (z-score) closely correlated with the SMOVE index. Both series peak in 2022 and gradually declined until March 2026. The former remains below the long-run average, despite the recent pickup.
b)
Euro area sovereign spreads and credit ratings
(x-axis: rating, y-axis: spread in basis points)
Panel b: A scatter plot of sovereign spreads versus credit ratings. The “Historical” series creates more steep and better fitted trendline showing that weaker ratings tend to be associated with higher spreads. The “Current” series creates less steep and somewhat more linear trendline.

Notes: Monthly data of daily average spreads of 10-year sovereign bonds vis-à-vis German bonds. Panel b) shows the average ratings from Fitch, Moody’s, and S&P, excluding Germany. Dotted lines represent the exponential trendlines. Current as of May 2026. Long-term average based on the available monthly data for euro area countries since January 2005.
Source: ESM calculations based on Bloomberg, Fitch, Moody’s, and S&P data

Hedge funds tend to be particularly sensitive to changes in yields and funding conditions, due to the high leverage deployed. 18 In non-stress periods, their presence may support liquidity. However, in periods of stress, if forced to unwind exposures, hedge funds could strain dealer intermediation capacity and amplify price swings (Box 1.5).19 In addition, if non-euro area hedge funds face liquidity stress from their large exposures to US Treasuries, they may also transmit the shock by unwinding positions in the euro area sovereign bond market.20  

Banks have returned to sovereign markets but reduced their home bias, while the role of other price-insensitive investors is shrinking. Banks have increased their holdings of sovereign bonds since the beginning of the ECB’s monetary policy normalisation with a reduced home bias, thereby diminishing – though not eliminating – doom loop risks (Figure 1.12b).21 Meanwhile, insurers’ sovereign bond holdings have fallen, with the share of total invested assets decreasing from 26% to 20% over the past five years. Over the medium to long term, pension funds are expected to follow suit as defined-contribution schemes expand, as exemplified by the Dutch pension reform.22This narrows the stable, less price-sensitive component of investor demand and increases reliance on investors whose behaviour under stress is harder to predict.   

  • 18

    See Alquist, R. and R. Yamarthy (2022).

  • 19

    See Ferrara et al. (2024).

  • 20

    See Bassi et al. (2024), Barth et al. (2025), and IMF (2026b). 

  • 21

    As of December 2025, the average share of domestic bonds over total assets in the euro area was 3.1%, though with some countries, including Slovakia, Italy, Greece, Spain and Malta, well above the euro area average. In recent years, banks have increasingly placed their sovereign holdings in their amortised cost portfolios. This practice mitigates the risk of unrealised losses stemming from short-term volatility pressures in sovereign bond markets but increases balance sheet opacity.

  • 22

    Under a defined-contribution scheme, pension funds have less need for long-term government bonds to hedge
    interest rate risk.

Figure 1.12

Investor structure in the euro area sovereign debt market and composition of banks’ sovereign bond holdings are changing

a)
Investor structure in the euro area sovereign debt market
(in % of marketable total sovereign debt)
b)
Banks’ sovereign bond holdings
(in % of total)

Notes: Panel a) shows the aggregate based on a subgroup of 11 euro area countries for which data is available: Austria, Belgium, Finland, France, Germany, Greece, Ireland, Italy, Netherlands, Portugal, and Spain. General government holdings of government debt are excluded. In Panel b), the "Domestic", "Other EA" and "Extra EA" refers to banks' holding of sovereign debt issues by their own sovereign, by other euro area sovereigns and by sovereigns outside the euro area, respectively. Sovereign exposures to the US account for around one-third of the extra euro area holdings. Latest available data is March 2026.
Sources: Panel a), ESM calculations based on ECB data; Panel b), ECB Balance Sheet Items data

Box 1.4

Analysing price sensitivity in euro area sovereign debt markets

This box examines how euro area sovereign yields respond to sudden shifts in investor demand, taking into account who holds government debt securities. Non-euro area investors have re-emerged as the largest holders of euro area sovereign bonds since the ECB began its monetary policy normalisation in 2022, but their presence varies widely across countries (from 8% to 40% of total outstanding amount, see Annex A4). The composition of the investor base may affect sovereigns’ resilience to unanticipated selloffs, as different investor profiles and mandates affect the capacity of bond markets to easily absorb additional supply at a given price. Focusing on differences across investor groups as an origin of financial market inelasticity, the framework developed by Gabaix and Koijen (2023) allows for assessing how asset prices respond to shifts in investor holdings when demand is imperfectly elastic. This box extends their approach to a panel of euro area sovereign debt markets and quantifies how an aggregate demand shock across investors translates into yield-spread changes vis‑à‑vis German government bonds.  

The composition of the sovereign investor base may shape sovereign yield sensitivity to demand shocks. A sample of nine euro area countries is classified into two groups: five countries with relatively high non-euro area investor shares (averaging 31%) and four with an investor base more concentrated in the euro area (with the foreign share averaging 14%). Euro area insurance companies and pension funds are also more prominent in the first group, whereas the Eurosystem, banks, and households account for larger shares in the second group.23

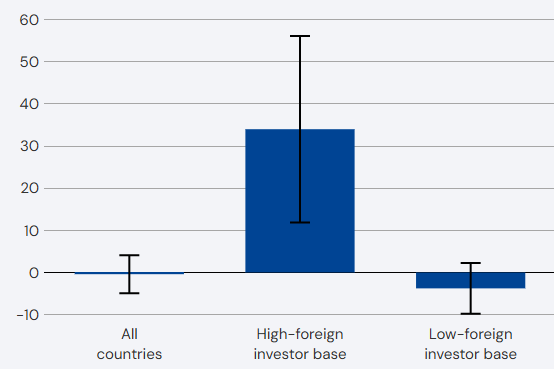
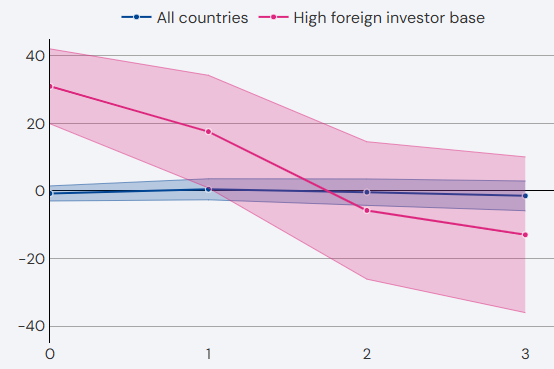
Demand shocks trigger larger price reactions in countries with a greater non-euro area investor footprint, reflecting higher sovereign sensitivity. In countries with high non-euro area investor participation, markets are relatively more inelastic (see Figure B1.4.1, left panel): a negative demand shock equivalent to 1% of outstanding debt raises yield spreads by around 30 basis points. By contrast, in countries with a more euro area-anchored investor base, the same shock has no significant effect. The difference might reflect the greater absorption capacity of euro area investors, including banks, insurers, and the Eurosystem. The spread widening in the first group, while meaningful, proves short-lived, as the effect becomes insignificant after the second quarter (Figure B1.4.1, right panel). 

Investor base composition is therefore an important factor contributing to sovereign bond market resilience. These findings also motivate further analysis of investor-specific demand elasticities in the euro area, similar to Chaudhary et al. (2024), who document substantial variation in price sensitivity across investor groups in the US Treasury market. 

  • 23

    To obtain consistent estimates of price sensitivities, the analysis applies, in a panel setting, the granular instrumental-variable approach of Gabaix and Koijen (2023), constructing a demand shifter independent of common factors. Controls also include inflation expectations, GDP growth, global risk conditions, monetary policy shocks, and new bond issuance. Yield dynamics are further examined using panel local projections (Jordà, 2005). Further details on the data and methodology can be found in Annex A4.

Figure B1.4.1

Yield spread sensitivity to exogenous investor demand shocks

a)
Price reaction to bond selloffs
(10-year spread change sensitivity to a 1% demand outflow, in basis points)
Yield spread sensitivity to exogenous investor demand shocks
b)
Dynamic price impact
(cumulative response on change in 10-year spread, in basis points)
Yield spread sensitivity to exogenous investor demand shocks

Notes: Panel a) shows estimated price sensitivities with 95% confidence intervals. Panel b) shows estimated impulse responses from panel local projections with 68% confidence intervals.
Source: ESM calculations based on ECB and Bloomberg data

1.4 The adverse scenario: geopolitical tensions persist in the Middle East and US asset prices adjust abruptly

This section translates the risk narratives and financial vulnerabilities discussed in Sections 1.2 and 1.3 into a quantified adverse macro-financial scenario for the euro area. The scenario combines two mutually reinforcing external shocks: prolonged geopolitical tensions, including a re-escalation in the Middle East, and a rise in US policy uncertainty that triggers a sharp repricing of US financial assets. It assumes no economic or monetary policy responses beyond the operation of automatic stabilisers. The model-based approach and details are described in Annex A6

The impact of the adverse scenario is assessed relative to a baseline consistent with the European Commission’s spring 2026 economic forecast. Under this baseline, euro area GDP growth is projected to slow to 0.9% in 2026, while inflation is expected to pick up to 3.0%, reflecting the impact of the current energy shock. In 2027, growth is projected to recover to 1.2%, and inflation to moderate to 2.3%. Notably, these projections are underpinned by energy price assumptions derived from futures markets, which at the time of the forecast were consistent with a relatively swift, albeit partial, normalisation of energy supply conditions. 


1.4.1 Risk layers, assumptions, and transmission channels

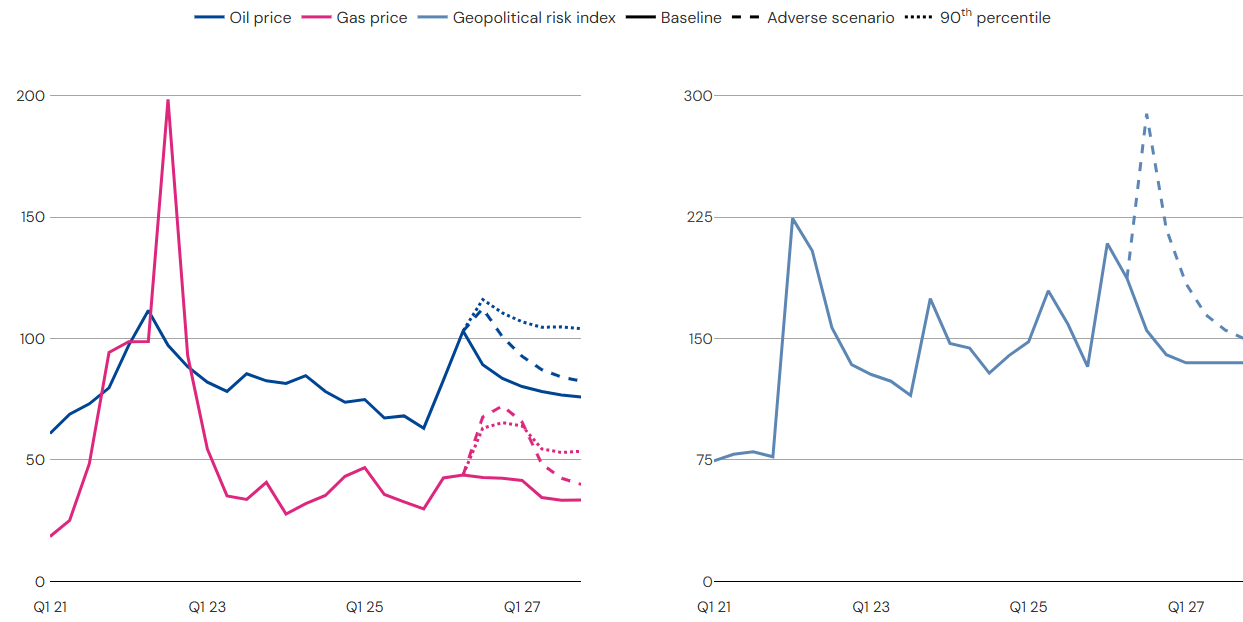
The first risk layer assumes prolonged geopolitical tensions in the Middle East. This is captured by a renewed surge in geopolitical risk indicators and wholesale oil and gas prices. This scenario is consistent with a re-escalation of US–Iran tensions, halting any incipient reopening of the Strait of Hormuz. The resulting disruptions in energy supply extend into late 2026. Consequently, geopolitical risk indicators and oil prices are assumed to reach levels close to those observed at the peak of the war in Ukraine (Figure 1.13). Gas prices also increase significantly, but remain well below the peaks observed in 2022, reflecting the different nature of the episodes. After the initial shock, these indicators gradually fade but remain above baseline levels over the medium term (Figure 1.13). 

Figure 1.13

Paths for energy prices and geopolitical risks under the adverse scenario

Oil and gas prices and geopolitical risk index
(left: Brent oil price in USD/barrel, TTF gas price in €/megawatt-hour; right: normalised, average 1998=100)
1.13.png

Notes: Left-hand chart shows 10-day average of oil (Brent) and gas (Title Transfer Facility, TTF) spot and futures prices up to the 28 April used for our baseline (solid lines), the dashed lines are the adverse scenario assumptions, and the dotted lines represent the 90th percentiles of the respective option-implied densities extracted over the same period, capturing the upper decile of market implied price distributions. Right-hand chart shows the in-house euro area-specific geopolitical risk indicator, constructed following Caldara and Iacoviello (2022) using newspapers from the four largest euro area countries (Bondarenko et al., 2026). The solid and dashed lines denote the baseline and adverse scenarios, respectively.
Source: Left-hand chart: ESM calculations based on energy prices from Haver and Bloomberg; right-hand chart: ESM calculations based on Factiva data

The second risk layer assumes a material repricing of US assets and a rise in global risk aversion. In the model, these are triggered by a sharp increase in US policy uncertainty24 to levels close to the April 2025 peak, when reciprocal US tariffs were announced. Investor appetite for US assets deteriorates, pushing US Treasury risk premia to late-2016 highs. Elevated US equity valuations adjust downward, while risk aversion in corporate bond markets also rises. The excess bond premium surges to pandemic‑era levels and credit spreads widen.

The interaction of these two risk layers leads to a substantial tightening of global financial conditions. The S&P 500 declines by almost 20% and the EURO STOXX by nearly 30% over 18 months, while equity market volatility rises by around 60% relative to the baseline. US 10‑year Treasury yields increase by more than 50 basis points, whereas euro area risk-free yields rise by a more modest 30 basis points, partly cushioned by portfolio rebalancing into euro area assets. Over the same period, the euro appreciates slightly, by around 2%, against the US dollar. 

The adverse scenario also incorporates amplification effects stemming from some of the financial vulnerabilities discussed in Section 1.3. In particular, it allows for mild amplification through higher bank risk aversion and a deterioration in non-financial corporations’ balance sheets (see Section 1.3). The exercise does not quantify amplification effects linked to vulnerabilities in the non-bank financial sector. They are considered tail risks that could further aggravate the disruption caused by an adverse scenario.  

1.4.2 Short-term impact: inflation rises sharply while the euro area enters recession in 2027

In the adverse scenario, growth slows sharply as investment adjusts disproportionately and inflation rises materially: 

  • GDP growth moderates to 0.6% in 2026 and -0.4% in 2027. By the end of 2027, GDP levels are 2.4% below the baseline scenario (Figure 1.14). The geopolitical shock dominates in 2026, weighing on consumption and investment. The US repricing channel and second round effects compound the drag in 2027 as tighter financial conditions and higher cost pressures for firms transmit more forcefully to the real economy. 
  • Exports see the largest adjustment, falling almost 7% below baseline by end-2027 as global demand weakens. Investment falls around 4.5%, as firms delay capital expenditure under uncertainty and tighter credit conditions. Consumption declines more moderately by around 1%, as wage growth is not enough to stabilise households’ purchasing power. 
  • Inflation rises to 3.7% in 2026 and 3.4% in 2027, driven initially by energy prices. Later on, spillovers to core inflation and second-round effects to wage settings contribute to a more persistent inflationary shock (Figure 1.14), further impairing growth. Monetary policy is assumed to not respond to inflationary pressures.  
  • 24

    US policy uncertainty index. ESM calculations based on Baker, Bloom, and Davis (2016) using Factiva data (the US Economic Policy Uncertainty index measures the frequency of newspaper articles discussing economic and policy-related uncertainty). 

Figure 1.14

Geopolitics dominate initially, amplified by US asset repricing and second-round effects

Contribution of risk drivers to the adverse-baseline gap
(lines: quarter-on-quarter growth rates in % for GDP, annual growth rates in % for inflation; bars: deviations from baseline in percentage points)

Notes: Bars indicate risk contribution to deviation of adverse scenario from baseline. “Geopolitical risks” comprises persistently higher geopolitical risks and energy prices; “US spillovers” assumes higher policy uncertainty and higher risk aversion towards US assets; “Second round effects” captures wage catch-up pressures.
Source: ESM calculations based on European Commission’s spring 2026 economic forecast and Eurostat data

1.4.3 Long-term economic scars from energy prices and uncertainty

Under the adverse scenario, prolonged uncertainty and higher energy prices result in a persistent loss of output in the euro area (Figure 1.15a). Higher-for-longer oil and gas prices raise production costs across the economy, eroding the international competitiveness of European manufacturers and weighing on activity well beyond the initial shock. Elevated uncertainty reinforces these effects by discouraging investment and impairing innovation. The two effects weigh on economic activity for a prolonged period, causing persistent losses in actual and potential output under the adverse scenario. While firms and households gradually adapt to the new environment and productivity recovers over time, the adjustment remains incomplete. By 2035, real GDP remains around 2% below baseline levels. 

Over time, inflation gradually shifts from reflecting upside cost pressures to demand-driven disinflation. As demand weakens and investment remains subdued, inflationary pressures gradually recede, offsetting earlier energy‑driven price increases. 

1.4.4 Uneven impact across countries reflects different economic structures and shock exposures

The impact of the adverse scenario varies across euro area countries, reflecting differences in economic structures and exposures to the shock (Figure 1.15b). While all member states face common headwinds, three features are associated with the cross-country differences in the impact on growth, inflation, and overall financial conditions: 

  • Energy import dependency and intensity. Countries with higher reliance on fossil fuel imports and a greater energy weight in production and consumption face stronger and more persistent headwinds, amplifying the impact of the adverse scenario. 
  • International trade integration. In more open economies, higher energy costs transmit rapidly through imported inputs and global production networks, magnifying the impact on domestic prices and competitiveness. Elevated geopolitical uncertainty weighs on global demand, disproportionately affecting countries with stronger international linkages. 
  • Sovereign market dynamics. Country-level financial conditions are also shaped by sovereign spread dynamics, which respond to both the rise in global risk aversion and domestic macro and fiscal fundamentals.  

The exercise does not account for country-specific exposures to US financial assets.  

Inflation paths also differ across countries. Economies with greater exposure to energy inputs face stronger short-term inflationary pressures, while more open economies experience faster pass-through from import prices to inflation. Price pressures ease and inflation moderates as demand weakens over time. Inflationary forces are more persistent in those economies with more rigid price- and wage-setting mechanisms. 

1.5 Implications for sovereigns: large fiscal challenges ahead, manageable only over time and with market trust

This section analyses the fiscal consequences for euro area sovereigns arising from the risks and vulnerabilities discussed in Sections 1.2 and 1.3. It assesses how weaker growth and tighter financial conditions affect the trajectories of public finances and analyses the required fiscal adjustments under the EU fiscal framework. The analysis zooms in on the short-term fiscal effects and longer-term implications for debt sustainability, while emphasising the role of market confidence in times of increasing political constraints.  

Figure 1.15

Long-run and cross-country implications of the adverse scenario

a)
Euro area real GDP level
(index, 2025=100)
b)
Distribution of real GDP level deviations across euro area countries
(in % deviation from baseline)

Note: Panel a) presents real GDP levels as an index (2025=100). Panel b) shows the distribution of country-level outcomes across euro area countries.
Source: ESM calculations based on European Commission’s spring 2026 economic forecast and Eurostat data

1.5.1 A fragile starting position with serious challenges ahead

The euro area is grappling with high government deficits and debt. The region moved onto a more tenuous fiscal trajectory in the aftermath of the Covid-19 pandemic and the Russian invasion of Ukraine. These shocks prompted determined fiscal responses, which helped accelerate the euro area’s recovery. Deficits and debt today remain above pre-pandemic levels in most euro area countries due to these measures and higher defence spending. The most recent conflict in the Middle East has renewed fiscal pressures, and higher interest rates complicate efforts to place public finances on sustainable paths. 

Aggregate numbers mask diverging fiscal performances across countries in recent years. About half of all euro area countries, including the five ESM beneficiary Member States (Cyprus, Greece, Ireland, Portugal, and Spain), have successfully pared back public debt and contained deficits since the pandemic, propelled by the solid recovery and rising tax receipts (ESM, 2026). These improvements are reflected in rating upgrades and sustained declines in their sovereign bond spreads relative to German government bonds. In contrast, the other half, including several countries of the region’s core, struggled to improve public finances, due to rising defence and infrastructure expenditure needs as well as growing interest payments (Figure 1.16). 

Figure 1.16

Contrasting debt and fiscal dynamics across countries since 2022

a)
Fiscal trajectories by country group (2022–2026)
(x-axis: headline budget balance; y-axis: public debt, in % of GDP)
b)
Cross-country fiscal developments (2022–2026)
(x-axis: change in public debt; y-axis: change in headline budget balance, in percentage points of GDP)

Notes: Panel a) shows the evolution of weighted average headline budget balances and public debt ratios for two groups of euro area countries between 2022 and 2026. The grouping is based on a composite indicator capturing average improvements in fiscal balances and public debt developments over the period. Country groups are weighted by nominal GDP. Each point represents one year from 2022 to 2026, with lines connecting years within each fixed country group. Panel b) shows cross-country fiscal developments between 2022 and 2026, measured as changes in public debt ratios and headline budget balances across euro area countries. Negative values on the x-axis indicate reductions in public debt ratios relative to 2022, while positive values on the y-axis indicate improvements in headline budget balances. EA stands for euro area.
Source: ESM calculations based on European Commission’s AMECO data

Fiscal pressures look set to persist. Under the baseline, fiscal pressures that have already emerged will gradually gain momentum, particularly in areas related to population ageing (such as healthcare and pensions). Higher inflation will temporarily provide some respite before additional factors start weighing on the public purse:  

  • Government financing costs are bound to rise as higher market interest rates permeate public budgets. By 2035, interest payments will more than double, averaging 5% of euro area GDP, explaining about two-thirds of overall fiscal deficits in many countries (Figure 1.17). 
  • Subdued outlook for growth: the euro area will struggle to grow out of its fiscal challenges. As a consequence, on the heels of an inflation-driven improvement in the short run, the interest-growth differential will steadily worsen, leading to less favourable debt dynamics.  

Risks to debt sustainability are hence already elevated in the baseline. In a no-policy-change scenario, aggregate public debt in the euro area would rise from levels close to 90% of GDP in 2025 to 103% of GDP by 2035. Gross financing needs will increase for most countries, with more than a third of all countries recording financing needs in excess of 20% of GDP in 10 years. Several countries with already-high debt are projected to continue running large deficits and have high financing needs, leaving them increasingly vulnerable to adverse market shocks. By contrast, several of the former ESM programme countries are projected to keep public debt on downward trajectories, strengthening their resilience.  

1.5.2 The adverse scenario: large fiscal adjustments only feasible if markets grant time

The immediate fiscal effects of geopolitical tensions and spillovers from US asset repricing are relatively contained, mitigated by inflation. Under the adverse macroeconomic scenario (Section 1.4) and no policy changes, national deficits and public debt levels change only marginally relative to baseline projections by 2027 (Figure 1.17b). Weaker economic activity dampens tax revenues, but this effect is offset by higher inflation. Primary expenditures are broadly unchanged, with most large spending categories unresponsive to economic conditions. Across countries, the fiscal impact is uneven, mirroring the severity of the adverse scenario (Section 1.4). Aggregate euro area financing needs climb to 19% of GDP, pushing up sovereign spreads. 

Over the longer run, however, the shocks further destabilise the debt trajectory in most countries. The adverse scenario affects debt sustainability risks over a longer horizon, through permanent scarring of economic activity, larger deficits and financing needs, and less favourable differentials between growth and interest rates. 

In addition, unmet defence spending commitments weigh on the public purse. Fiscal plans so far specify only partial progress towards the NATO target by 2035. Factoring in the remainder adds significant expenditure pressures, although a fraction of these could be self-financed in the long term (Chapter 2). For the purpose of this exercise, the 3.5% of GDP benchmark applies to all euro area countries, including those that are not NATO members. 

Under the adverse scenario, accounting for unmet military spending, public debt increases for all countries by 2035, except Cyprus and Greece. Compared to baseline projections, the average debt-to-GDP ratio in the euro area is about 20 percentage points higher. There is one silver lining: the impact of the shocks on public debt is not systematically related to the countries’ current debt levels; instead, the magnitude of impact is mostly related to the countries’ economic structures and specific vulnerabilities to external shocks such as energy dependency and trade openness. By implication, risks of debt divergence are more contained (Figure 1.17). 

Figure 1.17

Worse public deficits and debt by 2035 under the adverse scenario

a)
Higher initial public debt does not imply greater projected deterioration
(x-axis: public debt in 2025, in % of GDP; y-axis: change in public debt 2025–2035, in percentage points of GDP)
b)
Euro area headline budget balance decomposition
(2027 and 2035, in % of GDP)

Notes: Panel a) shows the public debt ratio in 2025 and the projected change by 2035 under the adverse scenario, based on euro area country-level projections. The dotted line represents a fitted trend line illustrating the relationship between initial debt levels and the projected change in debt ratios over 2025–2035. EA stands for euro area. Panel b) shows the decomposition of the aggregate euro area headline balance in 2027 and 2035. Under the baseline scenario, the balance is decomposed into the primary balance under the no-policy-change (NPC) scenario (including ageing-related costs) and interest expenditure. Under the adverse scenario, defence expenditure and its associated multiplier effects are additionally included. The headline budget balance is indicated by black dots.
Source: ESM calculations based on European Commission’s spring 2026 economic forecast data, European Commission's spring 2026 package data and the 2024 Ageing Report

Warding off the threat to debt sustainability requires large and sustained adjustments (Figure 1.18). The EU fiscal rules are crucial in helping keep fiscal stress at bay under the adverse scenario: they buy flexibility and time. If markets remain patient, they will give countries access to financing on reasonable, though more expensive, terms. Under these conditions, countries can adjust their fiscal positions gradually, postponing the moment of reversing their debt trajectories for several years. Under the adverse scenario, putting debt on a plausible downward path by 2035, as stipulated by the rules, requires cumulative adjustments that exceed what has historically been achieved in around half of the countries.25 The bulk of the adjustment would occur in the period 2030–2035, if the overall fiscal effort is backloaded. 

Large cumulative adjustments can spread over a long horizon, but at the risk of running into consolidation fatigue. In annual terms, and over the maximum horizon allowed by the EU’s Stability and Growth Pact, the average improvement in fiscal balances is about 0.6 percentage points of GDP in countries with non‑stabilising debt paths. Most countries have a track record of successfully delivering annual adjustments of this magnitude. But countries have typically recorded these over shorter time periods. Extending fiscal adjustments over long periods raises risks of consolidation fatigue, amid political resistance and electoral cycles.  

  • 25

    This result is obtained from a comparison between the ‘maximum realised’ adjustment in each country and the required adjustments under the adverse scenario (Figure 1.18). ‘Maximum realised’ is calculated as the largest positive cumulative change in the cyclically adjusted primary balance (CAPB) in the period 1995–2025 over a qualifying consolidation episode (see Annex A7 for details).

Figure 1.18

Large fiscal adjustment needs require difficult policy choices

Cumulative adjustment needs over 2026–2035, including additional fiscal effort for long-term spending pressures (defence and ageing costs)
(in percentage points of GDP)

Notes: Adjustment needs are split into (i) baseline needs stemming from initial budgetary conditions (ii) additional needs to offset adverse economic conditions; and (iii) long-term spending pressures from defence to reach NATO’s 3.5% of GDP target by 2035 and costs of ageing (2024 Ageing Report). Austria, Cyprus, Ireland, and Malta are not NATO members, but an increase in defence spending up to 3.5% of GDP target is also included in the exercise.
Source: ESM calculations based on European Commission’s AMECO data, spring 2026 package data and the 2024 Ageing Report


1.5.3 Upholding market trust under economic strain and political frictions 

Sovereign market conditions remain benign, but foundations are fragile. Despite significant fiscal risks, market sentiment towards euro area sovereign debt has so far remained broadly favourable (Box 1.5). Investors seem confident in the effectiveness of the existing fiscal framework. However, this relative stability is vulnerable (Section 1.3), not least because of the greater role of more price-sensitive investors in several euro area sovereign bond markets. 

In this setting, policy mistakes can incur disproportionate costs. The adverse scenario with elevated global risk aversion, combined with large and back-loaded fiscal adjustment needs, creates fertile ground for disproportionate market reactions to relatively small changes in domestic policies. If markets were to begin doubting countries’ commitment to the rules – because of policy steps that raise the likelihood of breaching spending limits or because of waning political capacity to deliver – investors may demand proof of willingness to consolidate on a much shorter timeline. In that case, the required fiscal adjustments become front-loaded and unfeasible if required over one or two budget cycles. This shift could move countries into sovereign stress territory much more quickly. 

Scope for new fiscal support under the adverse scenario is limited. Governments may be tempted to cushion the impact of the shocks, particularly that of higher energy prices, through broad-based support measures similar to those used in 2022. But repeating this type of fiscal response under adverse conditions involves complex trade-offs and would expose countries to new risks. 

  • The economic environment in 2022 was special, enabling broad fiscal support packages. Euro area countries’ growth was relatively fast after the pandemic, interest rates were lower (though rising), the Eurosystem was a major investor in euro area sovereign bonds, and the general escape clause of the EU’s Stability and Growth Pact was active. The adverse scenario in this report explores a very different economic environment. 
  • Most euro area countries have limited leeway for discretionary policy action. This constraint can be captured by an index that measures several metrics typically associated with room for fiscal manoeuvring: (i) debt levels and dynamics, (ii) deficits, and (iii) budget composition under adverse conditions (Annex A8). According to this index, lower growth and tighter financing conditions in the adverse scenario (leading to worse interest-growth dynamics) militate against broad-based fiscal support in response to the adverse shocks (Figure 1.19).  
  • Countries with the least fiscal space also confront the largest long-term needs (Annex A8). Higher military spending is increasingly important in a more volatile geopolitical environment and can generate positive growth spillovers in the long term (Chapter 2). Managing these long-term spending needs, including defence, will require clear prioritisation of large expenditure categories and, most likely, difficult choices. Maximising the growth impact of reprioritised spending can help to preserve fiscal space and maintain room to manoeuvre.  

Figure 1.19

Few countries retain ample fiscal space under the adverse scenario

Fiscal space index by country under baseline and adverse scenarios
(index, 0–100; 2028)

Notes: The horizontal dotted lines indicate the thresholds used to distinguish three fiscal space categories: ample (100–85), some (84–16), and limited (15–0). The index measures the relative fiscal space of euro area countries through a composite indicator combining four fiscal metrics under the baseline scenario in 2028: (i) revenue-to-debt ratio; (ii) budget balance; (iii) interest-growth differential; and (iv) share of usable revenue (revenue net of rigid spending). Fiscal space under the adverse scenario is assessed relative to the baseline distribution of the same indicators. See Annex A8 for more details.
Source: ESM calculations based on European Commission’s spring 2026 economic forecast data, Eurostat data, European Commission's spring 2026 package data and the 2024 Ageing Report

Domestic political factors could further constrain effectively available fiscal space. Fiscal support is often easier to roll out than to unwind. The experience of the 2022 energy crisis reinforces this concern: countries were more likely to maintain support measures for longer and rely more on broad-based energy price suppression where electoral pressure was stronger and political fragmentation greater (Figure 1.20). Price caps are particularly inefficient and untargeted, generally diminishing their stabilising effects.26

Upholding market confidence is key. The credibility of delayed consolidation hinges on markets believing governments are politically capable of course correction. Maintaining market trust will require prudent fiscal policy choices, including avoiding costly and inefficient price subsidies like those in 2022. More generally, markets are likely to look favourably upon temporary deviations from planned adjustments if discretionary fiscal support is both temporary and tailored to a well-identified need (e.g. temporary income support for the poor). Plans must be backed by transparent public outreach, grounded in prudent economic assumptions, and subject to independent monitoring (End, 2023; IMF, 2026a and 2021; OECD 2025).  

  • 26

    See Gabriel et al. (2026) for evidence on smaller fiscal multipliers under political fragmentation.

Figure 1.20

Political constraints related to the quality of fiscal response in 2022

a)
Share of energy price suppression measures in 2022 and election proximity
(x-axis: months, y-axis: in %)
b)
Duration of measures in 2022 and parliamentary fragmentation
(x-axis: number of parties, y-axis: days)

Notes: Panel a) shows the share of price suppression measures defined as total (gross) cost of measures classified as reduced, regulated, or capped marginal or average energy prices divided by total (gross) cost of all measures. Election proximity is measured as the number of months between 1 March 2022 and the next parliamentary election. Panel b) shows the duration in days calculated as the mean duration of all fiscal measures with positive gross fiscal cost as weights. Fragmentation is measured by the effective number of parliamentary parties, which captures the number of parties in parliament weighted by their seat shares. Cyprus and Malta are excluded.
Source: ESM calculations based on OECD (Energy Support Measures Tracker), WhoGov, and IPU Parline data

Box 1.5

Results from the ESM Sovereign Sentiment Survey

Results from a survey of 31 financial market participants active in euro area sovereign bond markets, conducted between 27 March and 17 April 2026. The sample includes issuers (debt management offices and treasuries), intermediaries, and investors. Details are presented in Annex A5. In addition to the survey, structured interviews were conducted with 18 market participants in April 2026.  

Sentiment is positive, but sovereign market dynamics are changing

Overall sentiment towards euro area sovereign bonds is broadly positive. 58% of respondents report positive or very positive sentiment towards euro area sovereign bonds. Foreign investors are seen as more likely to hold negative views (10%) than domestic investors (3%). Liquidity conditions are viewed as acceptable or good by 85% of respondents. Most expect the average maturity of euro area sovereign debt to decrease (45%) or remain stable (39%). 70% of respondents expect 10-year German government bond yields to be in the 3.0%-3.5% zone in 12 months (average: 3.1%). 

Euro area spread levels are seen as reflecting benign cyclical and structural conditions as well as euro area crisis response mechanisms. Views on current sovereign bond spreads vs German government bonds were mixed among survey respondents: 35% see them as somewhat or significantly compressed, 26% as appropriate, and 39% as somewhat wide. Discussions attribute current spread levels to improved fundamentals, confidence in euro area crisis response mechanisms, carry-trade appetite, and a structurally more favourable interest rate-growth differential since the pandemic.  

The growing presence of leveraged investment funds supports liquidity but could also amplify yield movements. Leveraged investment funds filling the gap left by other institutional investors makes euro area sovereign bond markets more price-sensitive: 61% of respondents expect leverage investment funds to play a destabilising role in high-volatility environments, and a neutral role in low-volatility environments (Figure B1.5.2a). Hedge funds are seen as supportive in primary markets – notably in bookbuilding, where they generate momentum – and associated with improved secondary-market liquidity, though liquidity may evaporate rapidly in stressed conditions. Some argued that hedge funds’ behaviour has migrated from a purely short-term, opportunistic approach to a more regular market presence. 

Banks and institutional investors are expected to absorb the bulk of net issuance. As monetary policy normalisation continues, banks are expected to absorb the largest share of net issuance (29%), followed by insurers and pension funds (23%), central banks outside the euro area (18%), leveraged funds (15%), and non-leveraged funds (10%). Interviewees also pointed out that policymakers are increasingly expecting insurers and pension funds to both finance the real economy through equity investment and absorb sovereign supply.


Geopolitical and inflation risks have not yet affected strategic positioning

Geopolitical tensions and persistent inflation dominate the risk landscape. Both topics were cited by almost 80% of respondents as major risks for sovereign markets, followed by fiscal sustainability issues and an economic slowdown (around one-third; Figure B1.5.1). Other concerns mentioned include failure to achieve strategic autonomy in defence, energy, and AI; unregulated AI; populism and political fragmentation of the EU; and the US policy trajectory. These risks could widen sovereign bond spreads. 

Investors are maintaining strategic positioning while issuers are adapting execution tactics. Despite recent volatility, fund managers have largely maintained strategic positioning, treating flare-ups as tactical rebalancing opportunities rather than triggers for long-term repositioning. Investors’ hedging strategies rely primarily on derivatives. To adapt to the current market environment and risks ahead, issuers cite liquidity buffers, prudent fiscal policy, and front-loading issuance. They are also shifting pricing references, adjusting tenor choices, shortening execution windows, offering higher new-issue premiums, and showing greater openness to reverse enquiries. US midterm elections are cited as the next potential volatility catalyst. 

Figure B1.5.1

Geopolitical escalation and persistent inflation as key risks

Most material adverse risks for euro area sovereign markets
(share of respondents, in %)

Note: Respondents were asked about most material adverse risks for euro area sovereign bond markets over the next 12 months.
Source: ESM Sovereign Sentiment Survey


A safe asset could help finance the response to geopolitical risks  

A euro area safe asset is seen as a tool to finance common public goods. Three-quarters of respondents consider a permanent, large-scale EU safe asset somewhat or very important for their investment activities. Interviewees make the case for a common asset for financing common public goods, rather than market stabilisation. Mirroring this, almost 80% of respondents expect higher defence expenditure to push yields moderately or significantly higher (Figure B1.5.2b). To sustain capital inflows into the region, respondents cite progress on savings and investments union (30%), greater fiscal union and a safe asset (20%), improved growth (15%), and more political cohesion (15%). 

Euro area sovereign issuance is attracting greater foreign interest, though US equity market outperformance has capped a broader shift. Continued strong US equity market performance in 2025 and 2026 is seen to have dampened a potential broader shift towards euro area assets in response to increased investor nervousness about the US policy trajectory. Some investors pointed out that an easing of geopolitical tensions could weaken the US dollar, with current strength reflecting the US’s energy exporter status rather than safe-haven demand. Several issuers noted increased interest in euro area issuance from non-euro area investors. Overall, 61% of respondents expect the euro to appreciate against the US dollar over the next 12 months.  

Figure B1.5.2

Relevant factors for the euro area sovereign outlook

a)
Role of leveraged investment funds in different environments
(share of respondents, in %)
b)
Impact of defence expenditure on euro area sovereign yields
(share of respondents, in %)

Source: ESM Sovereign Sentiment Survey

1.6 Conclusion: resilience requires credibility

The euro area is confronting a structurally less cooperative global environment with more frequent and mutually reinforcing adverse shocks. Geopolitical tensions, recurrent energy-price shocks, and the risk of abrupt market repricing have become persistent features of the macro-financial landscape. The euro area’s resilience to these shocks so far is remarkable, but policy space is limited. The risks examined in this report – prolonged geopolitical tensions raising energy prices, and spillovers from a sharp correction in US financial markets – could boost inflation, tip the euro area into recession, derail fiscal paths, and challenge benign pricing in euro area sovereign markets. Non-bank financial intermediaries and sovereign bond markets with a growing share of price-sensitive investors can amplify transmission and disproportionately tighten financial conditions.

Debt sustainability will deteriorate when risks materialise. High public debt, rising interest expenditures, and mounting structural spending pressures restrict room to cushion new shocks. The short-term fiscal impact of the adverse scenario considered appears contained, but medium-term debt dynamics place almost all euro area countries on upward debt trajectories, requiring sustained fiscal discipline over an extended period. In this environment, governments’ capacity to respond to shocks will be further constrained. This makes the ability and willingness of governments to face such adjustment requirements an important financial stability issue.  

A credible fiscal outlook preserving market trust is central to maintaining fiscal and economic resilience. Fiscal frameworks provide flexibility and buy time only if markets trust governments’ capacity to comply and deliver sustained adjustment. When fiscal room to manoeuvre is limited, targeted and temporary support is warranted under economic stress. Broad-based measures are costly. Where political fragmentation is larger, fiscal measures have proven more difficult to unwind, complicating the policy calculus. Rebuilding buffers, credible well-specified medium‑term fiscal plans that command broad support, and spending efficiently – embedding rising defence expenditure in a growth-friendly strategy to reduce its fiscal cost (discussed in Chapter 2) – could set in motion a virtuous cycle of stronger confidence, lower risk premia, and greater fiscal room to act.  

A strong EU institutional framework remains a critical source of collective resilience. Progress towards strategic autonomy, deepening the single market, and pursuing the green and digital transitions will reduce external vulnerabilities and strengthen the euro area’s position in the new global order. However, these take time to deliver, and the credibility of the European institutional setting needs preservation throughout. Current decisions to use the flexibility of the existing framework will affect future fiscal dynamics. The focus of the euro area safety net remains on safeguarding financial stability by preserving investor confidence, containing liquidity stress early, and ensuring that credible insurance mechanisms are ready before they are needed.  

1.7 References

Alquist, R. and R. Yamarthy (2022). Hedge funds and Treasury market price impact: Evidence from direct exposures. Office of Financial Research Working Paper 22-06. 

Baker, S. R., N. Bloom, and S. J. Davis (2016). Measuring economic policy uncertainty. Quarterly Journal of Economics, 131(4), 1593-1636. 

Barth, D., D. Beltran, M. Hoops, J. Kahn, E. Liu, and M. Perozek (2025). The cross-border trail of the treasury basis trade. FEDS Notes, 15 October 2025. 

Bassi, C., F. Hermes, S. Kördel, F. Lenoci, R. Pizzeghello, and A. Sowiński (2024). Financial stability risks from basis trades in the US Treasury and euro area government bond markets. ECB Financial Stability Review, May 2024. 

Bondarenko, Y., N. Kang, V. Lewis, M. Rottner, and Y. S. Schüler (2025). Geopolitical Risk in the Euro Area: Measurement and Transmission. Available at SSRN 5952714. 

Boni, S., M. Iseringhausen, I. Petrella, and K. Theodoridis (2026). A survey-based measure of asymmetric macroeconomic risk in the euro area. European Economic Review, 188, 105411. 

Brignone, D., L. Gambetti, and M. Ricci (2026). "Geopolitical risk shocks: when size matters." European Economic Review: 105392. 

Caldara, D. and M. Iacoviello (2022). Measuring geopolitical risk. American Economic Review, 112(4), 1194–1225. 

Callegari, G., V. Michou, K. Slawinska, D. Žigraiová, and F. Tomasone (2025). Spending composition and fiscal consolidation: Enhancing resilience in the face of economic shocks. ESM Working Paper 73.

Capolongo, A., M. Kuehl, and V. Skovorodov (forthcoming). Uncovering nonlinearities: Geopolitical Risk Shocks in the Euro Area. ESM Working Paper. 

Chaudhary, M., J. Z. Fu, and H. Zhou (2024). Anatomy of the Treasury market: Who moves yields? Olin Business School Research Paper No. 2024/14. 

Congressional Budget Office (2026). 10-year budget projections, February 2026. 

Cornevin, A. and J. Peppel-Srebrny (2026). Less special, less contagious? US Treasury supply spillovers to Bund yields. ESM Blog, 1 June 2026. 

End, N. (2023). Big brother is also being watched: Measuring fiscal credibility. Journal of Macroeconomics, 77, 103548. 

European Central Bank (2022). The Transmission Protection Instrument, 21 July 2022. 

European Central Bank (2025). Hedge fund activity in bond, repo and futures markets: Unpacking the data. Bond Market Contact Group, 26 November 2025. 

European Commission (2024). 2024 Ageing report: Economic and budgetary projections for the EU Member States (2022–2070), European Economy Institutional Paper No. 279. 

European Commission (2026). European economic forecast: Spring 2026. 

European Commission (2026). 2026 European Semester: Spring package. 

European Stability Mechanism (2026). Annual Report 2025.

European Systemic Risk Board (2026). Financial stability risks from geoeconomic fragmentation, January 2026. 

Ferrara, F. M., T. Linzert, B. Nguyen, I. Rahmouni-Rousseau, M. Skrzypińska, L. Vaz Cruz (2024). Hedge funds: good or bad for market functioning? ECB Blog, 23 September 2024. 

Gabaix, X. and RSJ. Koijen (2023). Granular Instrumental Variables. Journal of Political Economy. 123(7), 2274-2303. 

Gabriel, R. D., M. Klein, and M. Noeller (2026). Fiscal Multipliers and Political Fragmentation. Working Paper. 

Gnewuch, M. (2026). Stronger fundamentals, new challenges: Greece's sovereign debt. ESM Blog, 27 January 2026. 

Goosen, K., M. Grothe, P. McQuade, A. Sowiński, and S. Wredenborg (2024). Low implied equity market volatility could underestimate financial stability vulnerabilities. ECB Financial Stability Review, May 2024. 

Gürkaynak, R. S., B. Kısacıkoğlu, and J. H. Wright (2020). Missing events in event studies: Identifying the effects of partially measured news surprises. American Economic Review, 110(12), 3871-3912.  

Hudecz, G., A. Lauwers, Y. Mimir, G. Schiliuk, L. Ong, H. Zhao, and D. del Rosario (2024). Geoeconomic fragmentation: Implications for the euro area and ASEAN+3 regions. ESM Discussion Paper No. 23. 

International Monetary Fund (2021). Fiscal monitor: Strengthening the credibility of public finances, October 2021. 

International Monetary Fund (2025). Global financial stability report, October 2025. 

International Monetary Fund (2026a). Fiscal monitor: Fiscal policy under pressure: High debt, rising risks, April 2026. 

International Monetary Fund (2026b). Global financial stability report, April 2026. 

Jančoková, M., E. Mallucci, M. Ricci, and L. Tondo, (2026). The euro as a safe-haven currency amid geopolitical tensions and policy uncertainty. The international role of the euro. ECB, June 2026. 

Jordà, Ò. (2005). Estimation and inference of impulse responses by local projections. American Economic Review, 95(1), 161-182.