
Authors




Security at what cost? Defence spending, growth, and the fiscal arithmetic
Europe faces increased security financing needs that bring both challenges and opportunities. At the 2025 Hague Summit, North Atlantic Treaty Organization (NATO) allies committed to raising core defence spending toward 3.5% of GDP, well above the old 2% benchmark. This would mean an extra €45 billion a year for the euro area until 2035. While on paper the target looks like a straightforward bill for taxpayers, recent analysis presented in the Euro Area Stability Watch suggests it is more nuanced: when defence spending supports investment, innovation, and productivity, part of the initial cost can be recovered through higher growth and tax revenue.
An additional €45 billion bill a year, but not the full story
At a time of elevated public debt in many countries, higher spending can affect growth, public finances, and debt dynamics and ultimately have implications for financial stability. For the euro area, closing that gap means tens of billions of euros more each year.
Figure 1
Euro area spending gap and chronic underinvestment
Defence spending
(in % of GDP)
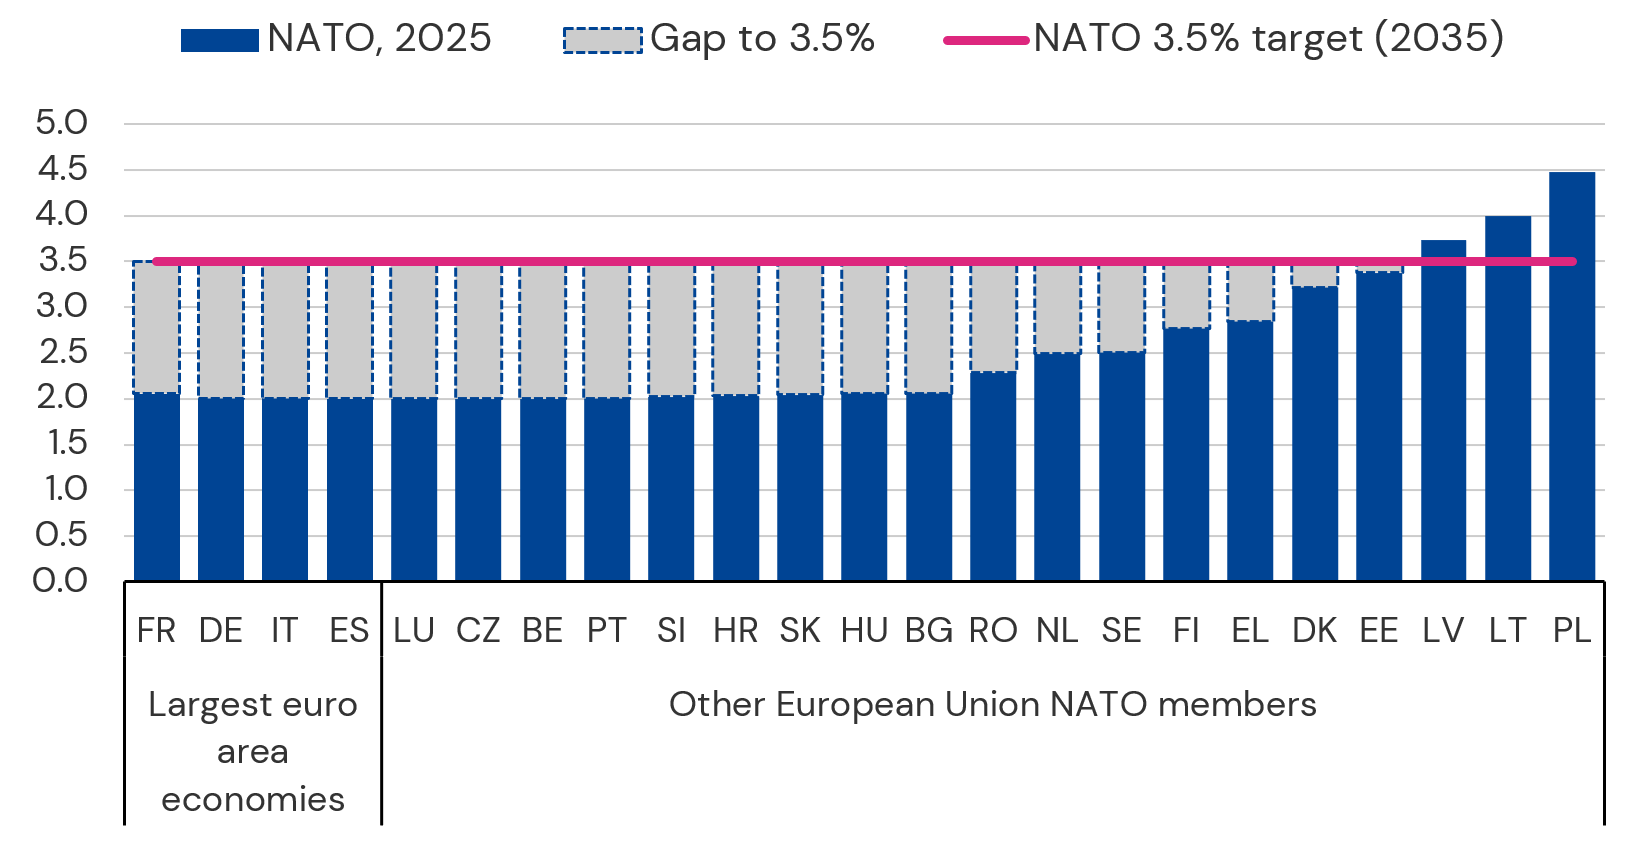
Notes: Data may differ from Eurostat/COFOG owing to accounting differences, including the treatment of military pensions and equipment down payments. The broad trends are consistent across sources.
Source: European Stability Mechanism calculations based on NATO definitions and data
A narrow reading of the fiscal arithmetic stops there: more spending, more debt. But it misses the other side of the ledger. Higher defence spending also creates jobs, drives investment and – if targeted well – makes firms more productive. Those effects feed back into growth and tax revenue, quietly offsetting part of the original cost.
New European Stability Mechanism (ESM) research quantifies this macroeconomic and fiscal feedback: up to 53 cents of every additional euro spent on defence can come back to the government through a stronger economy. That means more than halving the real cost of the increase in defence spending.
Why defence firms matter beyond the battlefield
Europe still underinvests in the areas of defence that have the biggest economic payoff. Salaries eat up over 40% of the European Union’s defence budget, and research and development gets only around 3% – a quarter of the United States’ level.
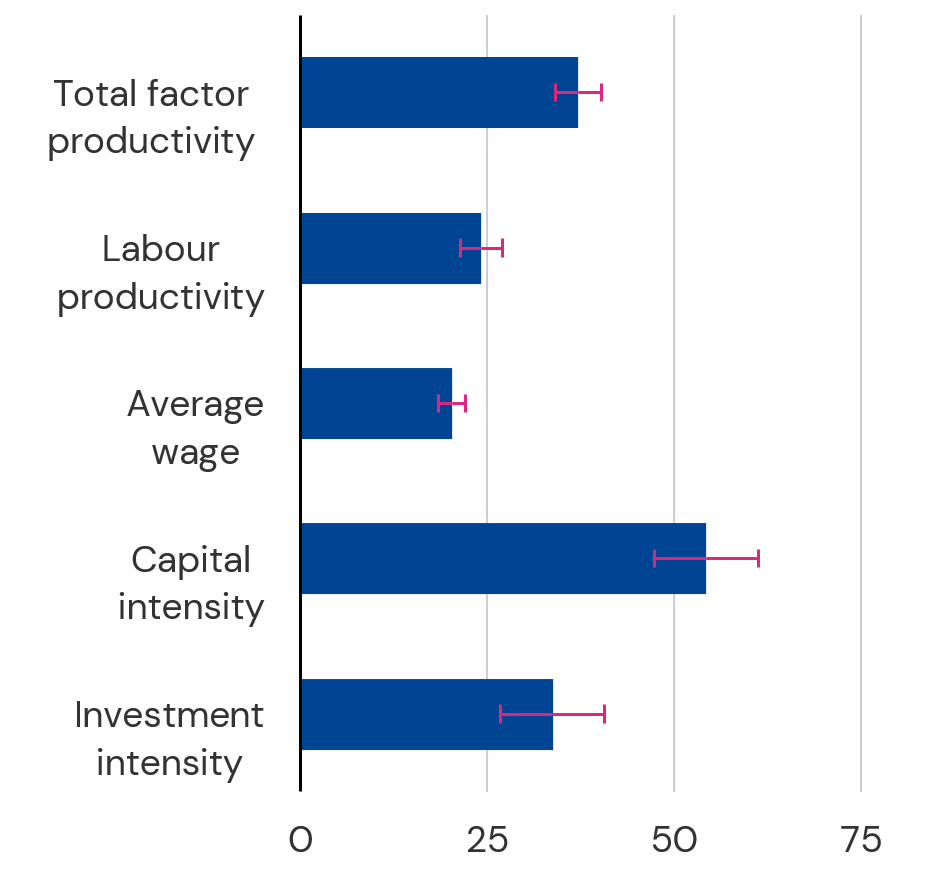
That matters because defence firms are not just consumers of public money; they are unusually productive. Drawing on a dataset of more than 1,300 defence-related firms across France, Germany, Italy, and Spain, ESM analysis finds that although these firms account for less than 2% of total business revenue, they are disproportionately concentrated in high-tech sectors. Compared with civilian firms in the same industries, they show around 40% higher productivity and invest 35% more intensively, whether in machinery or research and development.
Crucially, those gains don't stay contained. Around 85% of the inputs used by civilian suppliers to defence firms are sourced within the euro area, and the data show this supply chain is where the real economic spillover happens. A 10% increase in defence-related investment is linked to a measurable rise in productivity among the upstream civilian firms that supply parts and services to defence producers, engineers, electronics makers, and materials firms as they invest to meet demanding technical standards. The effect is strongest among suppliers that were already relatively more productive, suggesting a firm needs a baseline level of capability to absorb and benefit from this kind of technology transfer.
Figure 2
Defence sector as a catalyst for economy-wide productivity gains
a) Differentials between defence and other firms
(in %, whiskers denote 95% confidence intervals)
b) Dependence on euro area supply chains
(in %, share of total intermediate inputs)
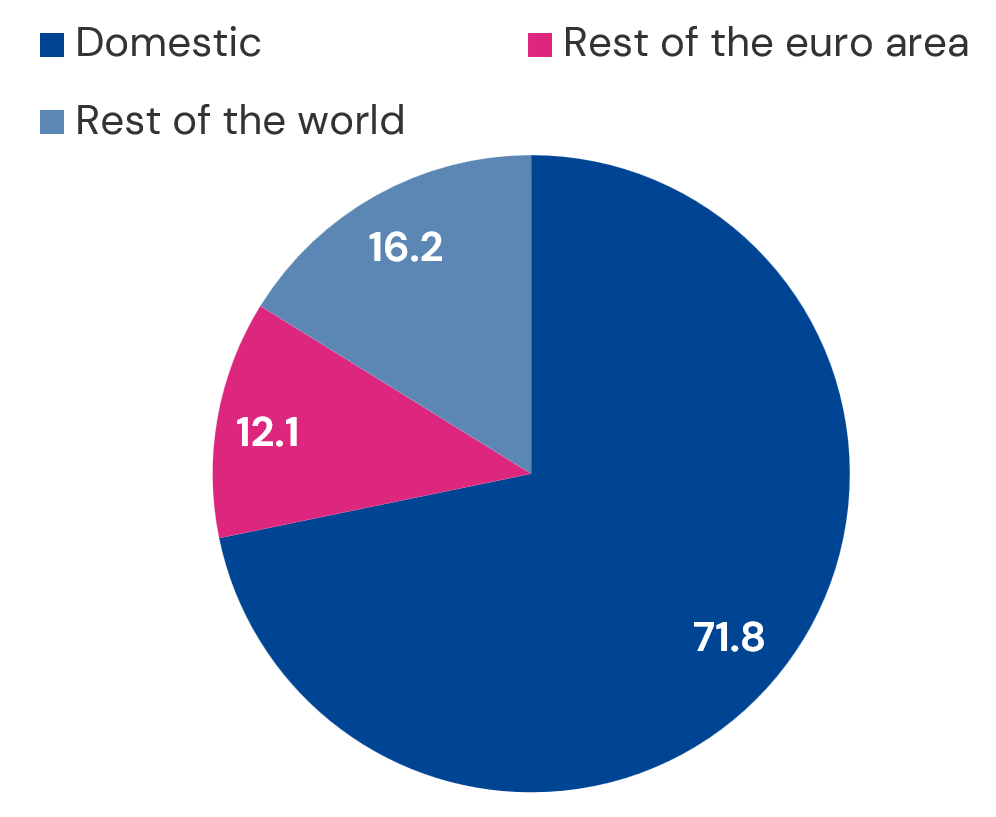
Notes: In Panel a), bars report, for each firm characteristic, the estimated percentage differential between defence firms and non-defence firms operating in the same country-sector. A positive value indicates that defence firms exhibit higher levels of the corresponding characteristic. In Panel b), for the defence sector, each upstream sector is weighted by the share of total material costs incurred by defence firms operating in that sector. Upstream suppliers are drawn from sectors other than those in which defence firms operate. The resulting weighted average is then shown for the defence sector as a whole and broken down into selected NACE two-digit sectors. Further details are provided in Euro Area Stability Watch Chapter2.
Source: ESM calculations based on ESM firm-level database and Orbis (Moody’s Analytics) data
Four conditions shape the fiscal payoff
Feeding this evidence into a macroeconomic model, the analysis simulates a steady, decade-long increase in euro area defence spending. Four factors are particularly important in determining the size of the European fiscal payback:
- Composition. Spending on capital-intensive and research and development-intensive equipment sourced from European suppliers is more likely to activate productivity spillovers. Spending on salaries, maintenance, or imported off-the-shelf kits does not, dropping the payback to around 25 cents on the euro, less than half as much.
- Financing. Reallocation of public spending towards defence preserves more of the growth feedback, while higher labour taxes weaken the tax base and reduce self-financing.
- Debt containment. Letting debt drift up permanently, rather than stabilising it through a credible fiscal rule, pushes up real interest rates and adds around 5% to the true cost of the build-up.
- The European dimension of procurement. Security benefits and supply-chain gains cross borders. EU-wide procurement can deepen the defence single market, reduce fragmentation, enable larger orders, lower unit costs, and help smaller economies integrate into European supply chains, even without a large defence industry of their own.
- European common financing. Common financing can help reinforce gains. Instruments such as SAFE can, if implemented well, add a second layer of efficiency by easing national fiscal constraints, supporting joint investment at scale, and better aligning costs with the cross-border nature of security benefits.
The bottom line
Europe's defence build-up doesn't have to be a pure fiscal burden. The growth and revenue feedback depends on the composition of spending, the financing strategy, and the credibility of debt containment. If these conditions are properly addressed, it can generate meaningful economic returns alongside the security it buys.
Read the full chapter in the Euro Area Stability Watch for the underlying model, the firm-level data, and historical parallels.
Acknowledgements
The authors would like to thank Raquel Calero, Pilar Castrillo, Cédric Crelo, Peter Lindmark, and Rolf Strauch for their valuable suggestions and contributions to this blog.
Go to the report
Blog manager

About the ESM blog: The blog is a forum for the views of the European Stability Mechanism (ESM) staff and officials on economic, financial and policy issues of the day. The views expressed are those of the author(s) and do not necessarily represent the views of the ESM and its Board of Governors, Board of Directors or the Management Board.