
Debt sustainability analysis under uncertainty: mapping the past into the future
ESM Briefs is a concise presentation of research by ESM staff members, helping readers better understand and navigate current economic policy debates. More about ESM Briefs

Abstract
This brief presents the ESM’s stochastic debt sustainability analysis (DSA) framework.[1] The approach integrates historical experience with baseline projections to generate visual representations in the form of fan charts that show the range and likelihood of possible future debt paths. A formal statistical evaluation confirms that these fan charts carry predictive power for medium-term distress episodes, providing the foundation for a risk classification based on the DSA.
The authors would like to thank Rolf Strauch and Giovanni Callegari for advice and guidance, Tim Willems for his valuable comments and suggestions in improving the framework, and Karol Siskind for editorial support.
Debt Sustainability Analysis
Debt sustainability analysis (DSA) is a cornerstone of sovereign risk monitoring. It provides a structured framework to assess whether public debt levels are on a sustainable path and whether governments will be able to finance themselves under plausible future conditions. For policymakers, a well-designed DSA serves three functions: (i) it helps identify risks at an early stage, (ii) informs fiscal and financial policies to mitigate those risks, and (iii) supports market confidence by providing a transparent basis for sovereign debt assessments. For institutions such as the European Stability Mechanism (ESM), DSA is also critical in guiding lending decisions when countries request financial assistance.
Debt sustainability is typically assessed through a deterministic DSA, i.e. one that projects the debt-to-GDP ratio along a single path, based on assumptions about key macroeconomic, financial, and fiscal variables. The evolution of debt can be attributed to three key drivers: (i) the primary deficit, (ii) the interest rate minus growth differential (r – g), and (iii) stock–flow adjustments.[2] Projecting these variables provides an internally consistent forecast for debt dynamics.
Yet, economic shocks are frequent, often correlated with each other, and can produce non-linear effects on debt paths. These interactions mean that a single-point forecast provides little information about the risks surrounding the baseline path. To overcome this shortcoming, international institutions have developed stochastic DSAs, which incorporate uncertainty into the analysis. Instead of a single trajectory, stochastic DSAs produce a fan chart[3] showing the distribution of possible debt paths. This probabilistic approach (i.e. considering a range of possible future scenarios) provides a richer and more realistic view of debt sustainability risks, and it has become a standard tool in international surveillance frameworks.
Building on the International Monetary Fund’s 2021 “Review of the Debt Sustainability Framework for Market Access Countries”,[4] the ESM has developed its own stochastic DSA methodology. The ESM approach was designed to better capture the asymmetric nature of risks around baseline debt projections. This reflects the reality that upside risks do not always balance downside risks. It also provides a formal statistical assessment of the capacity of fan charts to predict distress episodes in the medium term. The framework combines model-based forecasts with country-specific expert judgment, ensuring that assessments reflect both historical regularities and institutional expertise.
The following sections present the fan chart methodology and the assessment framework in detail and show how it enhances the ESM’s ability to identify risks and safeguard financial stability in the euro area.
Fan chart methodology
The ESM fan chart methodology is designed to capture potentially asymmetric risks around deterministic baseline debt projections, while remaining anchored in historical experience. Unlike the traditional approach of applying shocks to the baseline, the ESM framework follows a two-step procedure: first, stochastic projections are generated from an independent empirical model; second, these projections are adjusted or “tilted” toward the baseline forecast. In this setup, while the baseline still represents the most likely scenario within the forecast range, fan charts are generally asymmetric, reflecting the observation that historical correlations often carry valuable information about the direction of risks.
Step one: Bayesian VAR for the model-based simulations
In the first step, model-based simulations for the main debt drivers are produced independently of deterministic baseline projections. These simulations are generated using a quarterly Bayesian VAR (BVAR)[5] with seven variables: real GDP growth, GDP deflator growth, the primary surplus, the 3-month Euribor, the 10-year German bond yield, and the long-term spread to the 10-year German bond yield. To guide the long-term behaviour of these variables, the model includes prior means (similar to Villani, 2007), i.e. assumptions based on the judgment of country economists and informed by sources like the European Commission’s Ageing Report[6], historical averages, or economic theory. The framework also allows for sudden changes in patterns, ensuring flexibility in capturing shifts in economic dynamics.
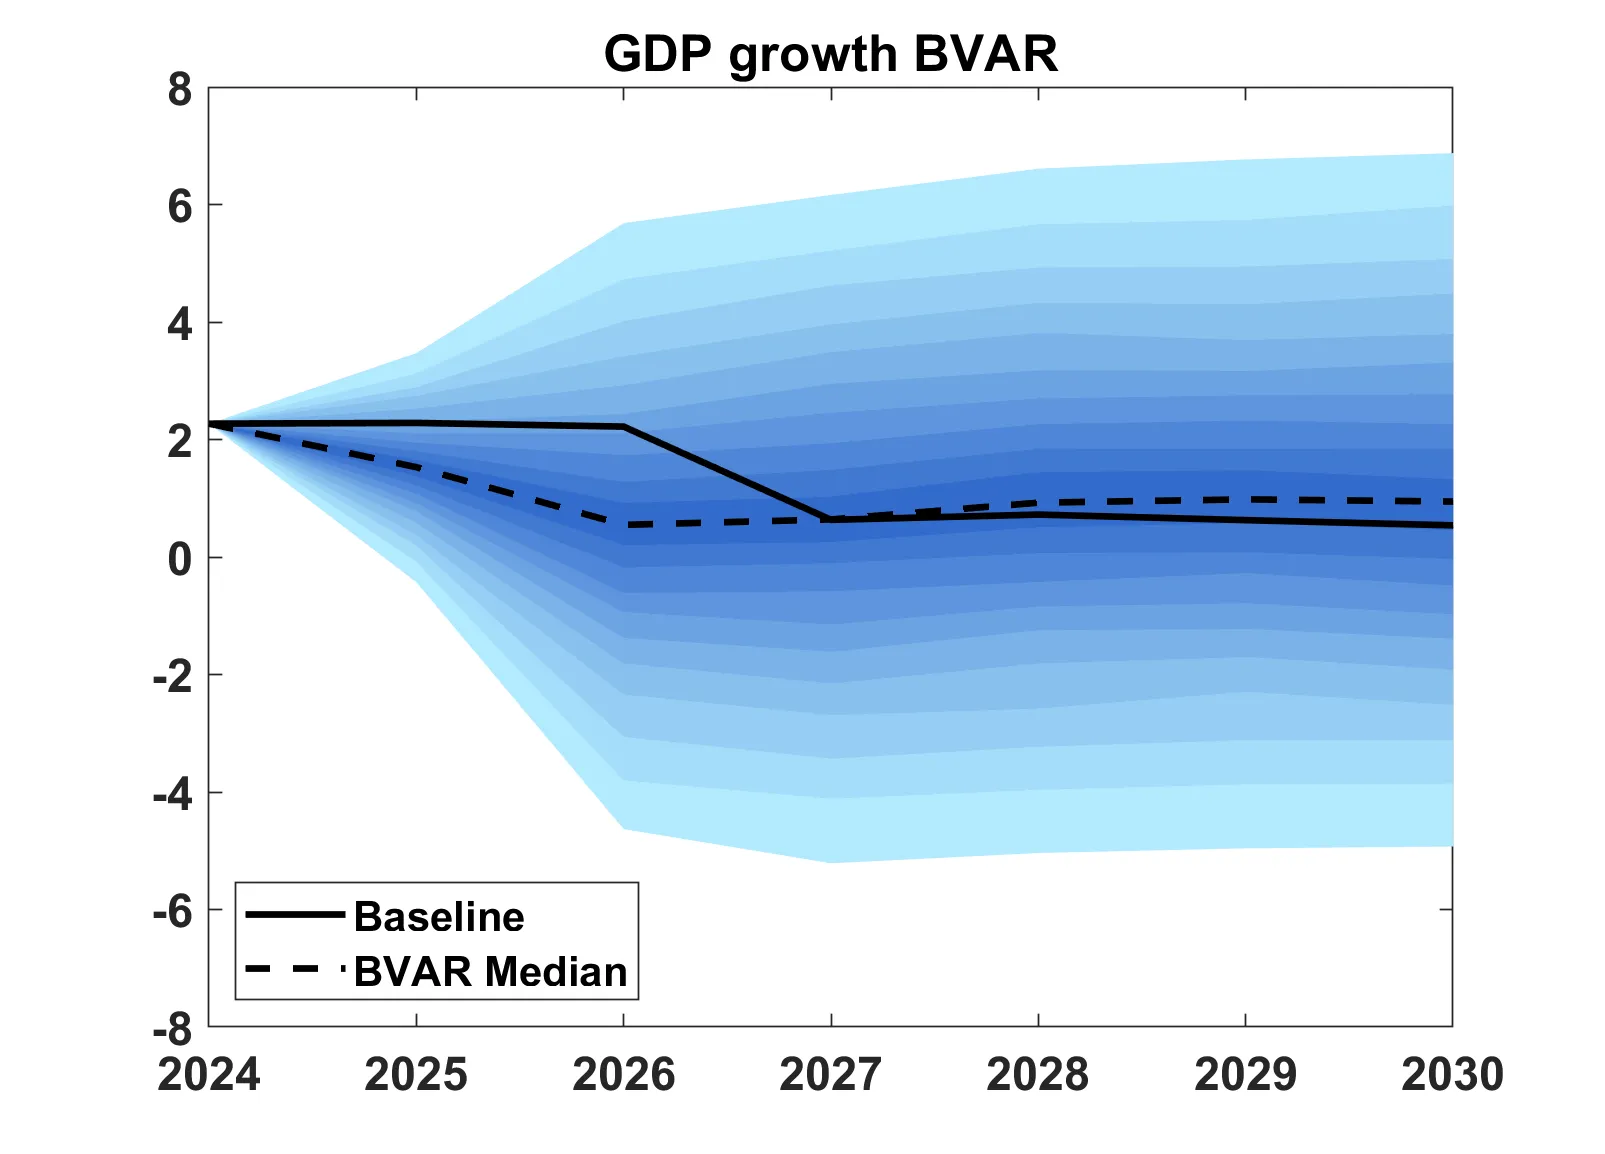
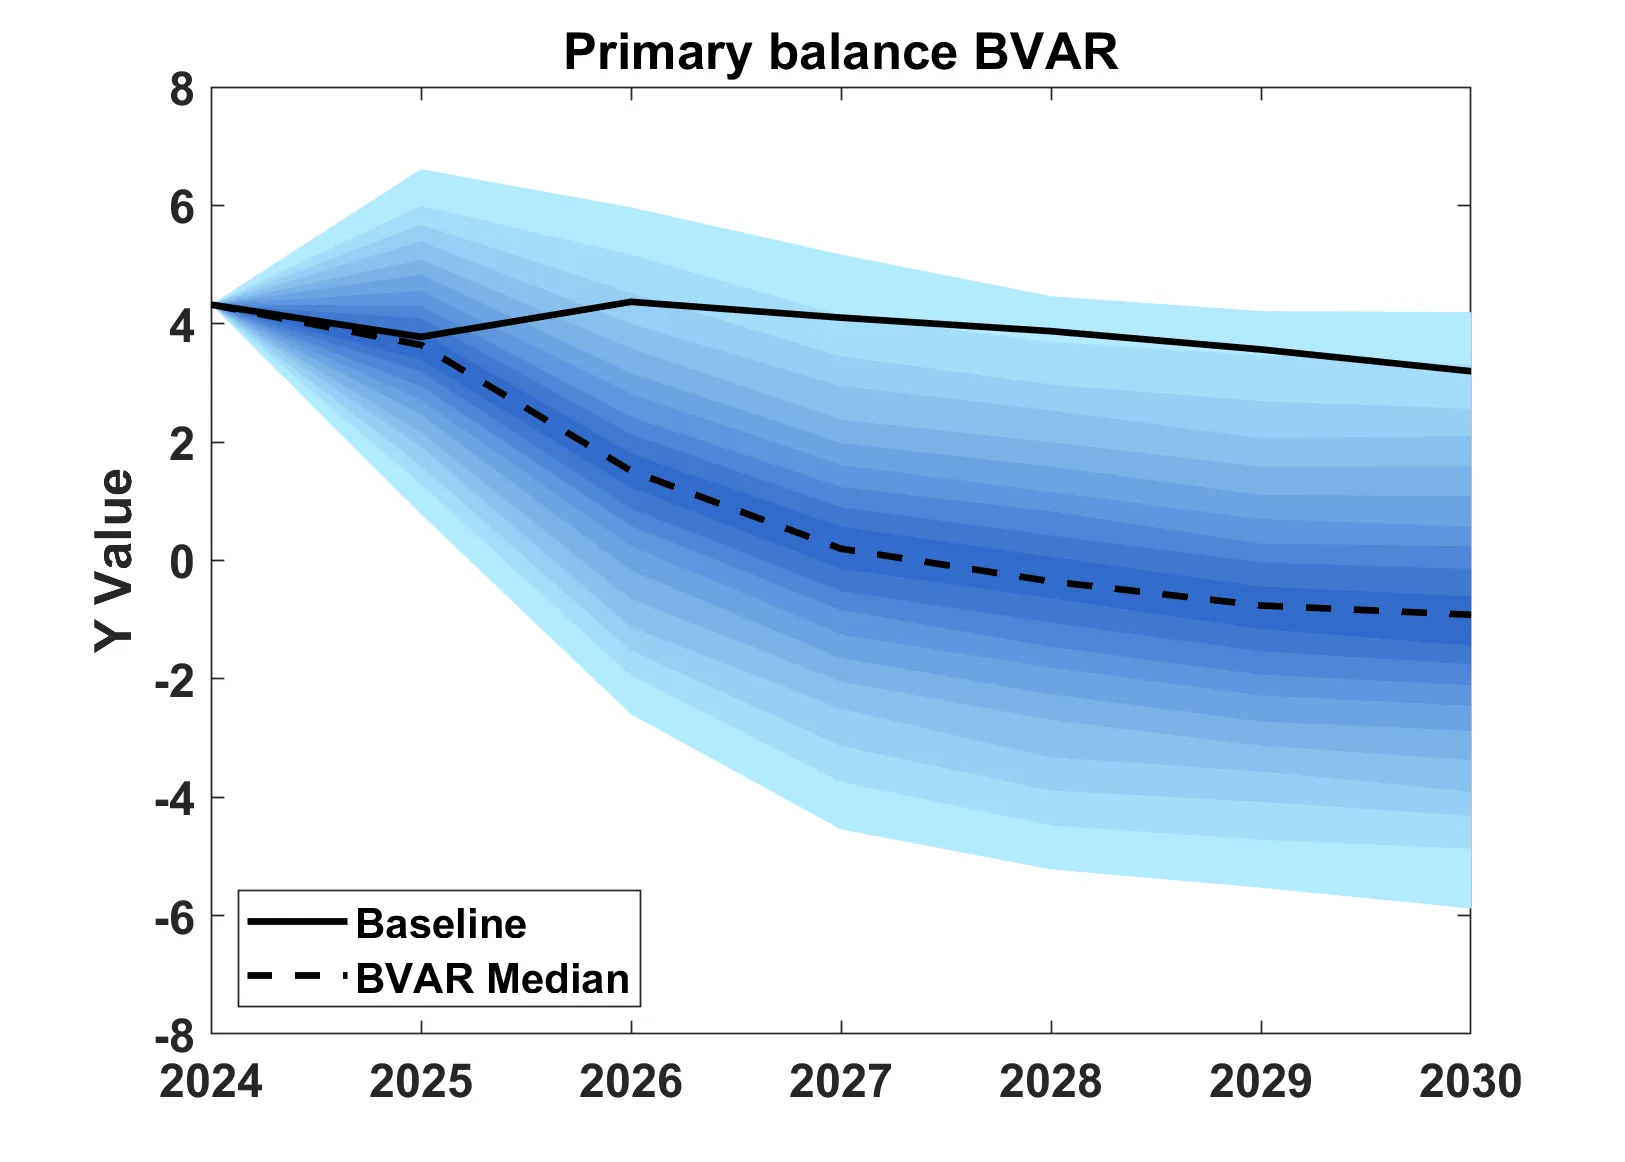
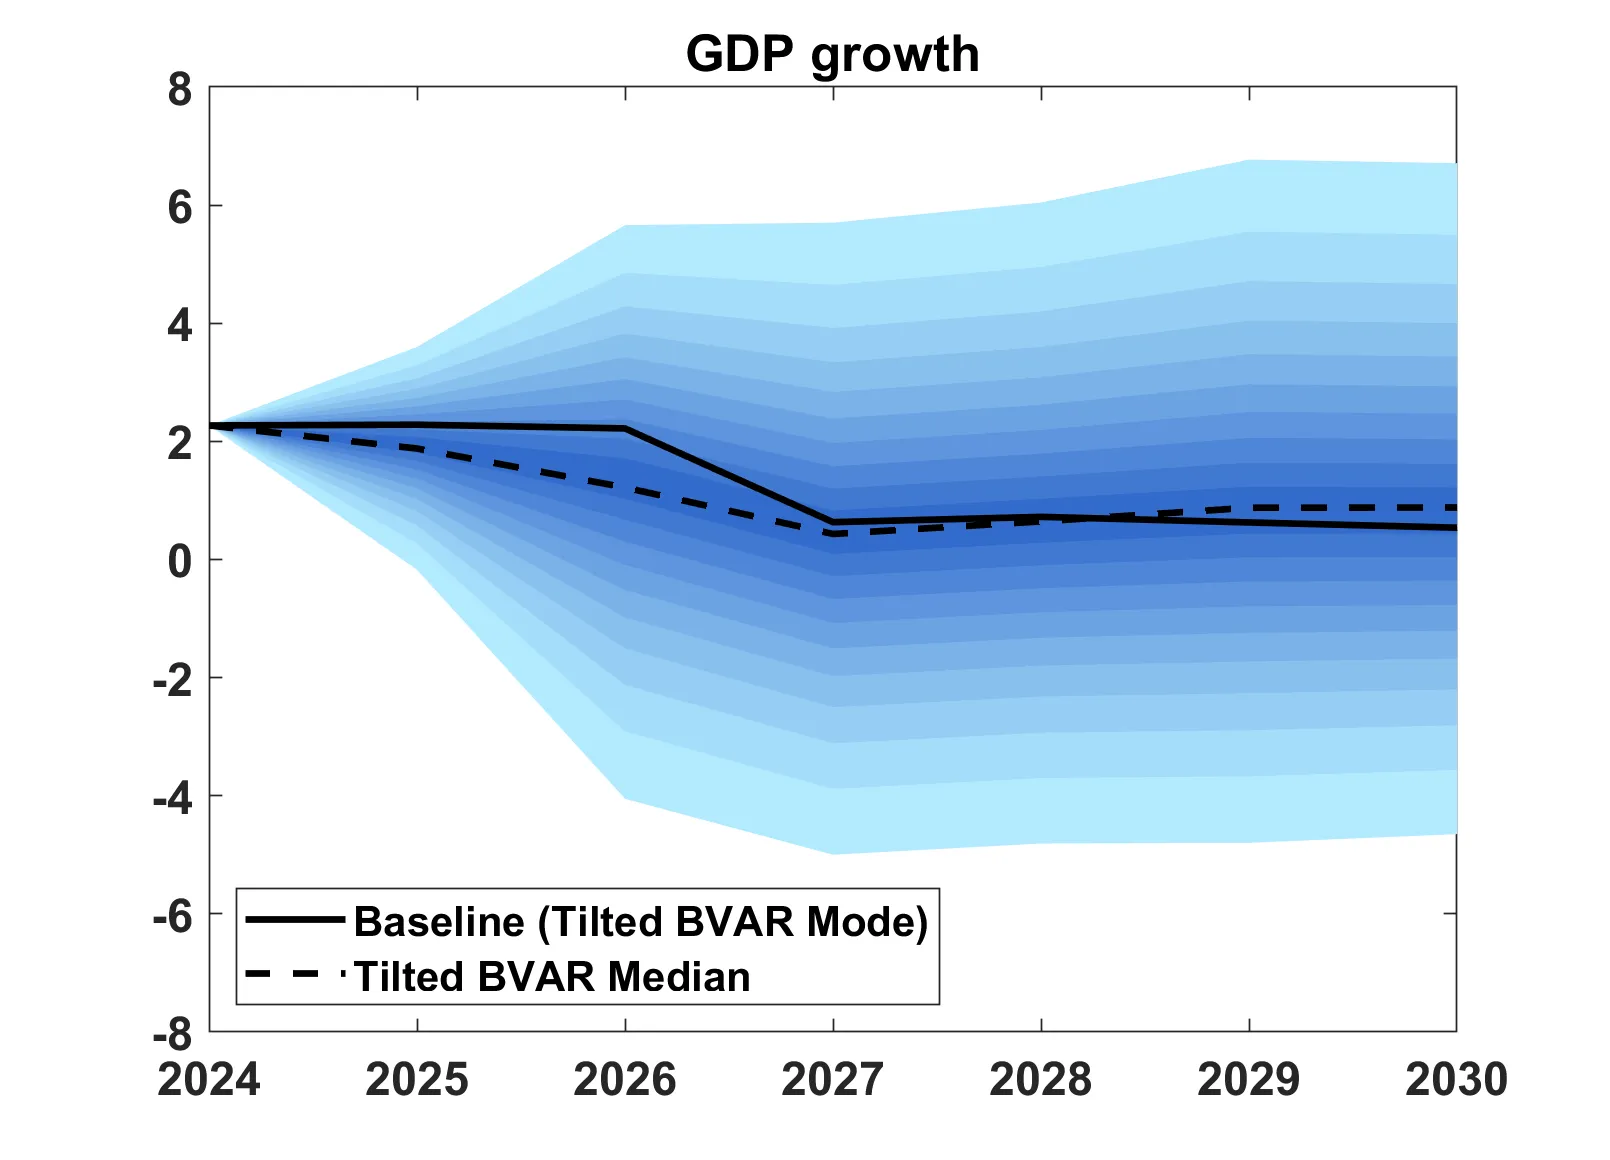
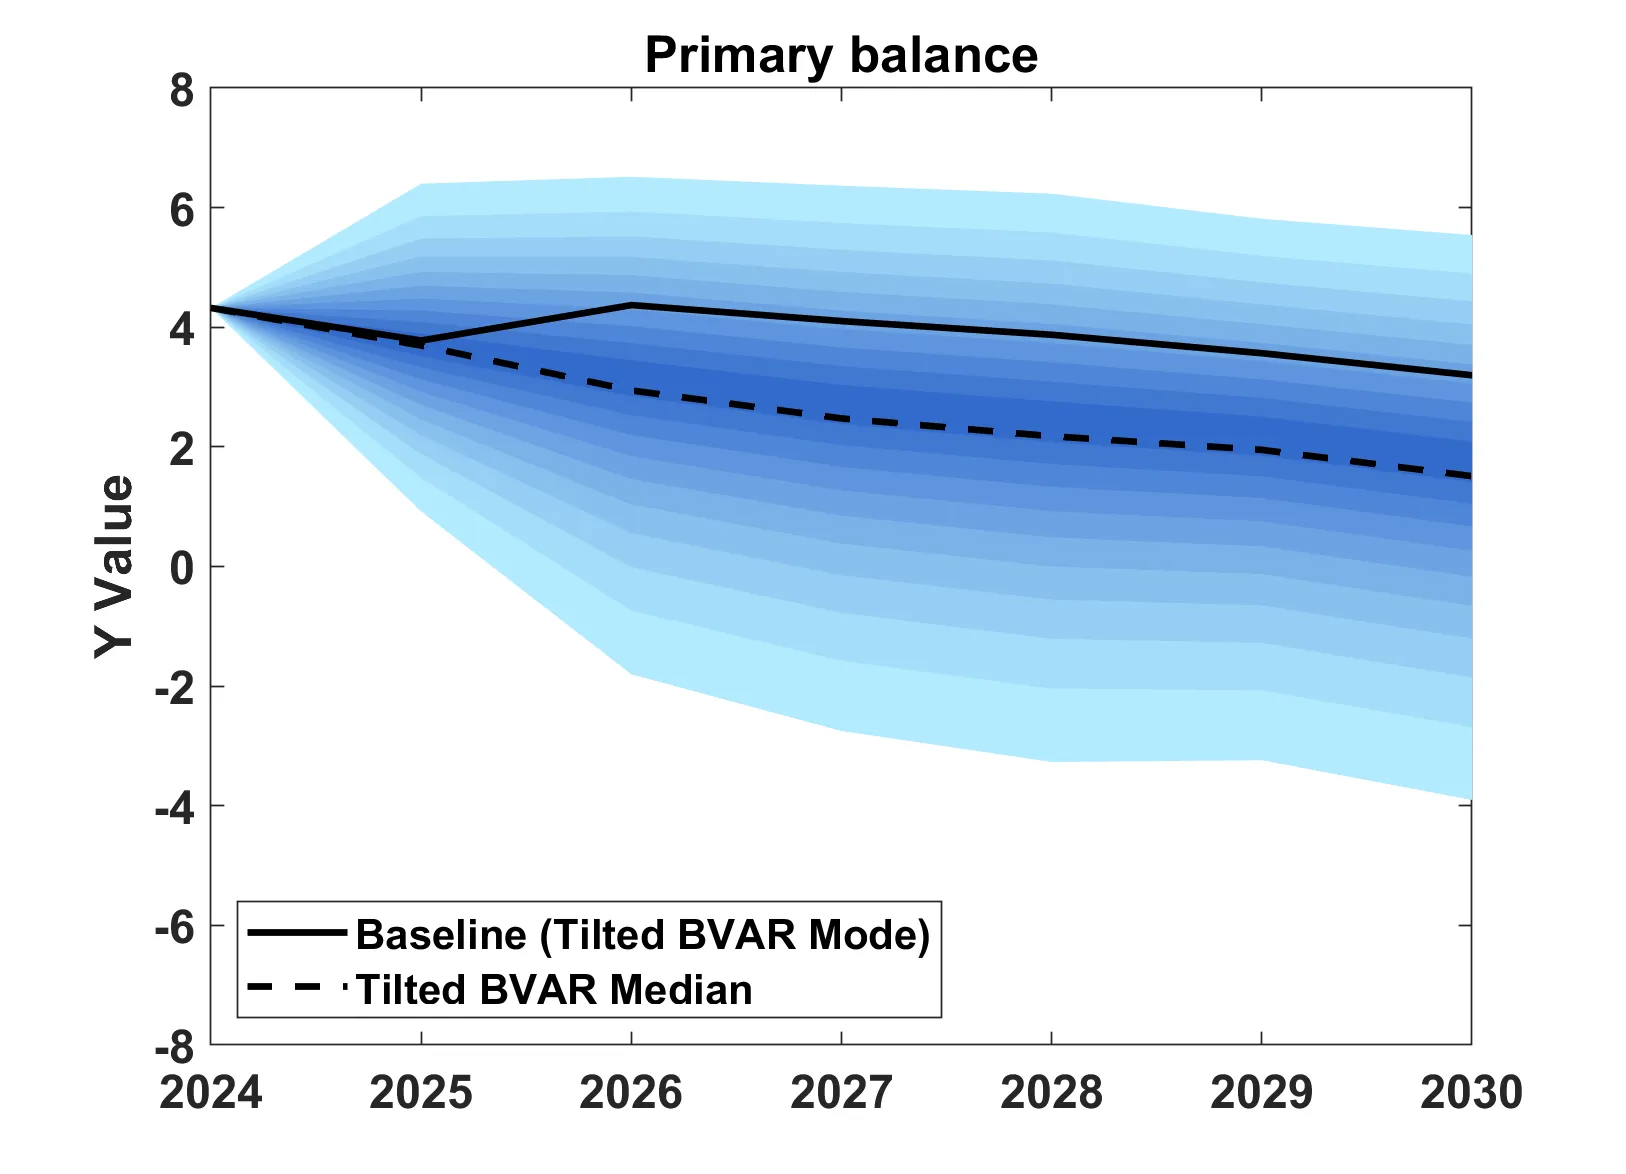
Figure 1
Projections from the VAR and the ‘tilted’ VAR for Greece. GDP growth aligns with the baseline, yielding a symmetric fan chart, while the VAR projects a weaker primary balance as the latter has lately overperformed compared to the past. The tilting adjustment shifts it toward the baseline but preserves greater probability mass in the lower tail.
Fan charts for each debt driver provide a benchmark to assess the plausibility of their baseline assumptions in light of historical evidence. Since the deterministic baseline typically builds on the European Commission’s latest forecast, which combines model results with expert judgment, as well as on a set of mechanical assumptions for the medium term[7], it often differs from the BVAR projections. This divergence is informative: reflecting on the “disagreement” between the two helps assess the likelihood that the baseline may turn out to be optimistic or pessimistic, thereby offering insights into the direction of risks (see also the IMF’s DSA framework for market access countries).
Step two: anchoring to the baseline
In the second step, the deterministic baseline is combined with the BVAR simulations. The baseline information is used to adjust the BVAR forecasts so that they better align with expert and institutional projections. The procedure adjusts the model’s forecast distribution for each debt driver so that it places greater emphasis on outcomes close to the deterministic baseline.
This integration produces asymmetric fan charts, where the degree of asymmetry reflects how much the model and baseline projections differ. When these differences are large, the fan chart becomes more asymmetric, indicating whether risks are tilted toward higher or lower debt outcomes. As later sections will show, this approach has proven useful in anticipating crisis episodes.
It is noteworthy that the ESM adjusts the distribution of risks systematically for each debt driver, rather than only at the overall debt level. Also, the ESM applies the adjustment in all cases to ensure a consistent treatment of risk across scenarios. The final debt fan chart is then built by combining the adjusted projections for each debt component through the same debt aggregation model used in the baseline scenario. The resulting fan chart shows the range of possible future debt paths, excluding the most extreme 10% of outcomes at both ends.
A relatively symmetric chart can occur either because the BVAR forecasts closely match the baseline, or because differences across individual debt drivers cancel each other out.
By contrast, a strongly asymmetric chart signals that some baseline assumptions differ substantially from historical patterns. To fully understand the results, the final debt fan chart should always be considered together with the individual debt-driver fan charts, which highlight the main sources of risk.
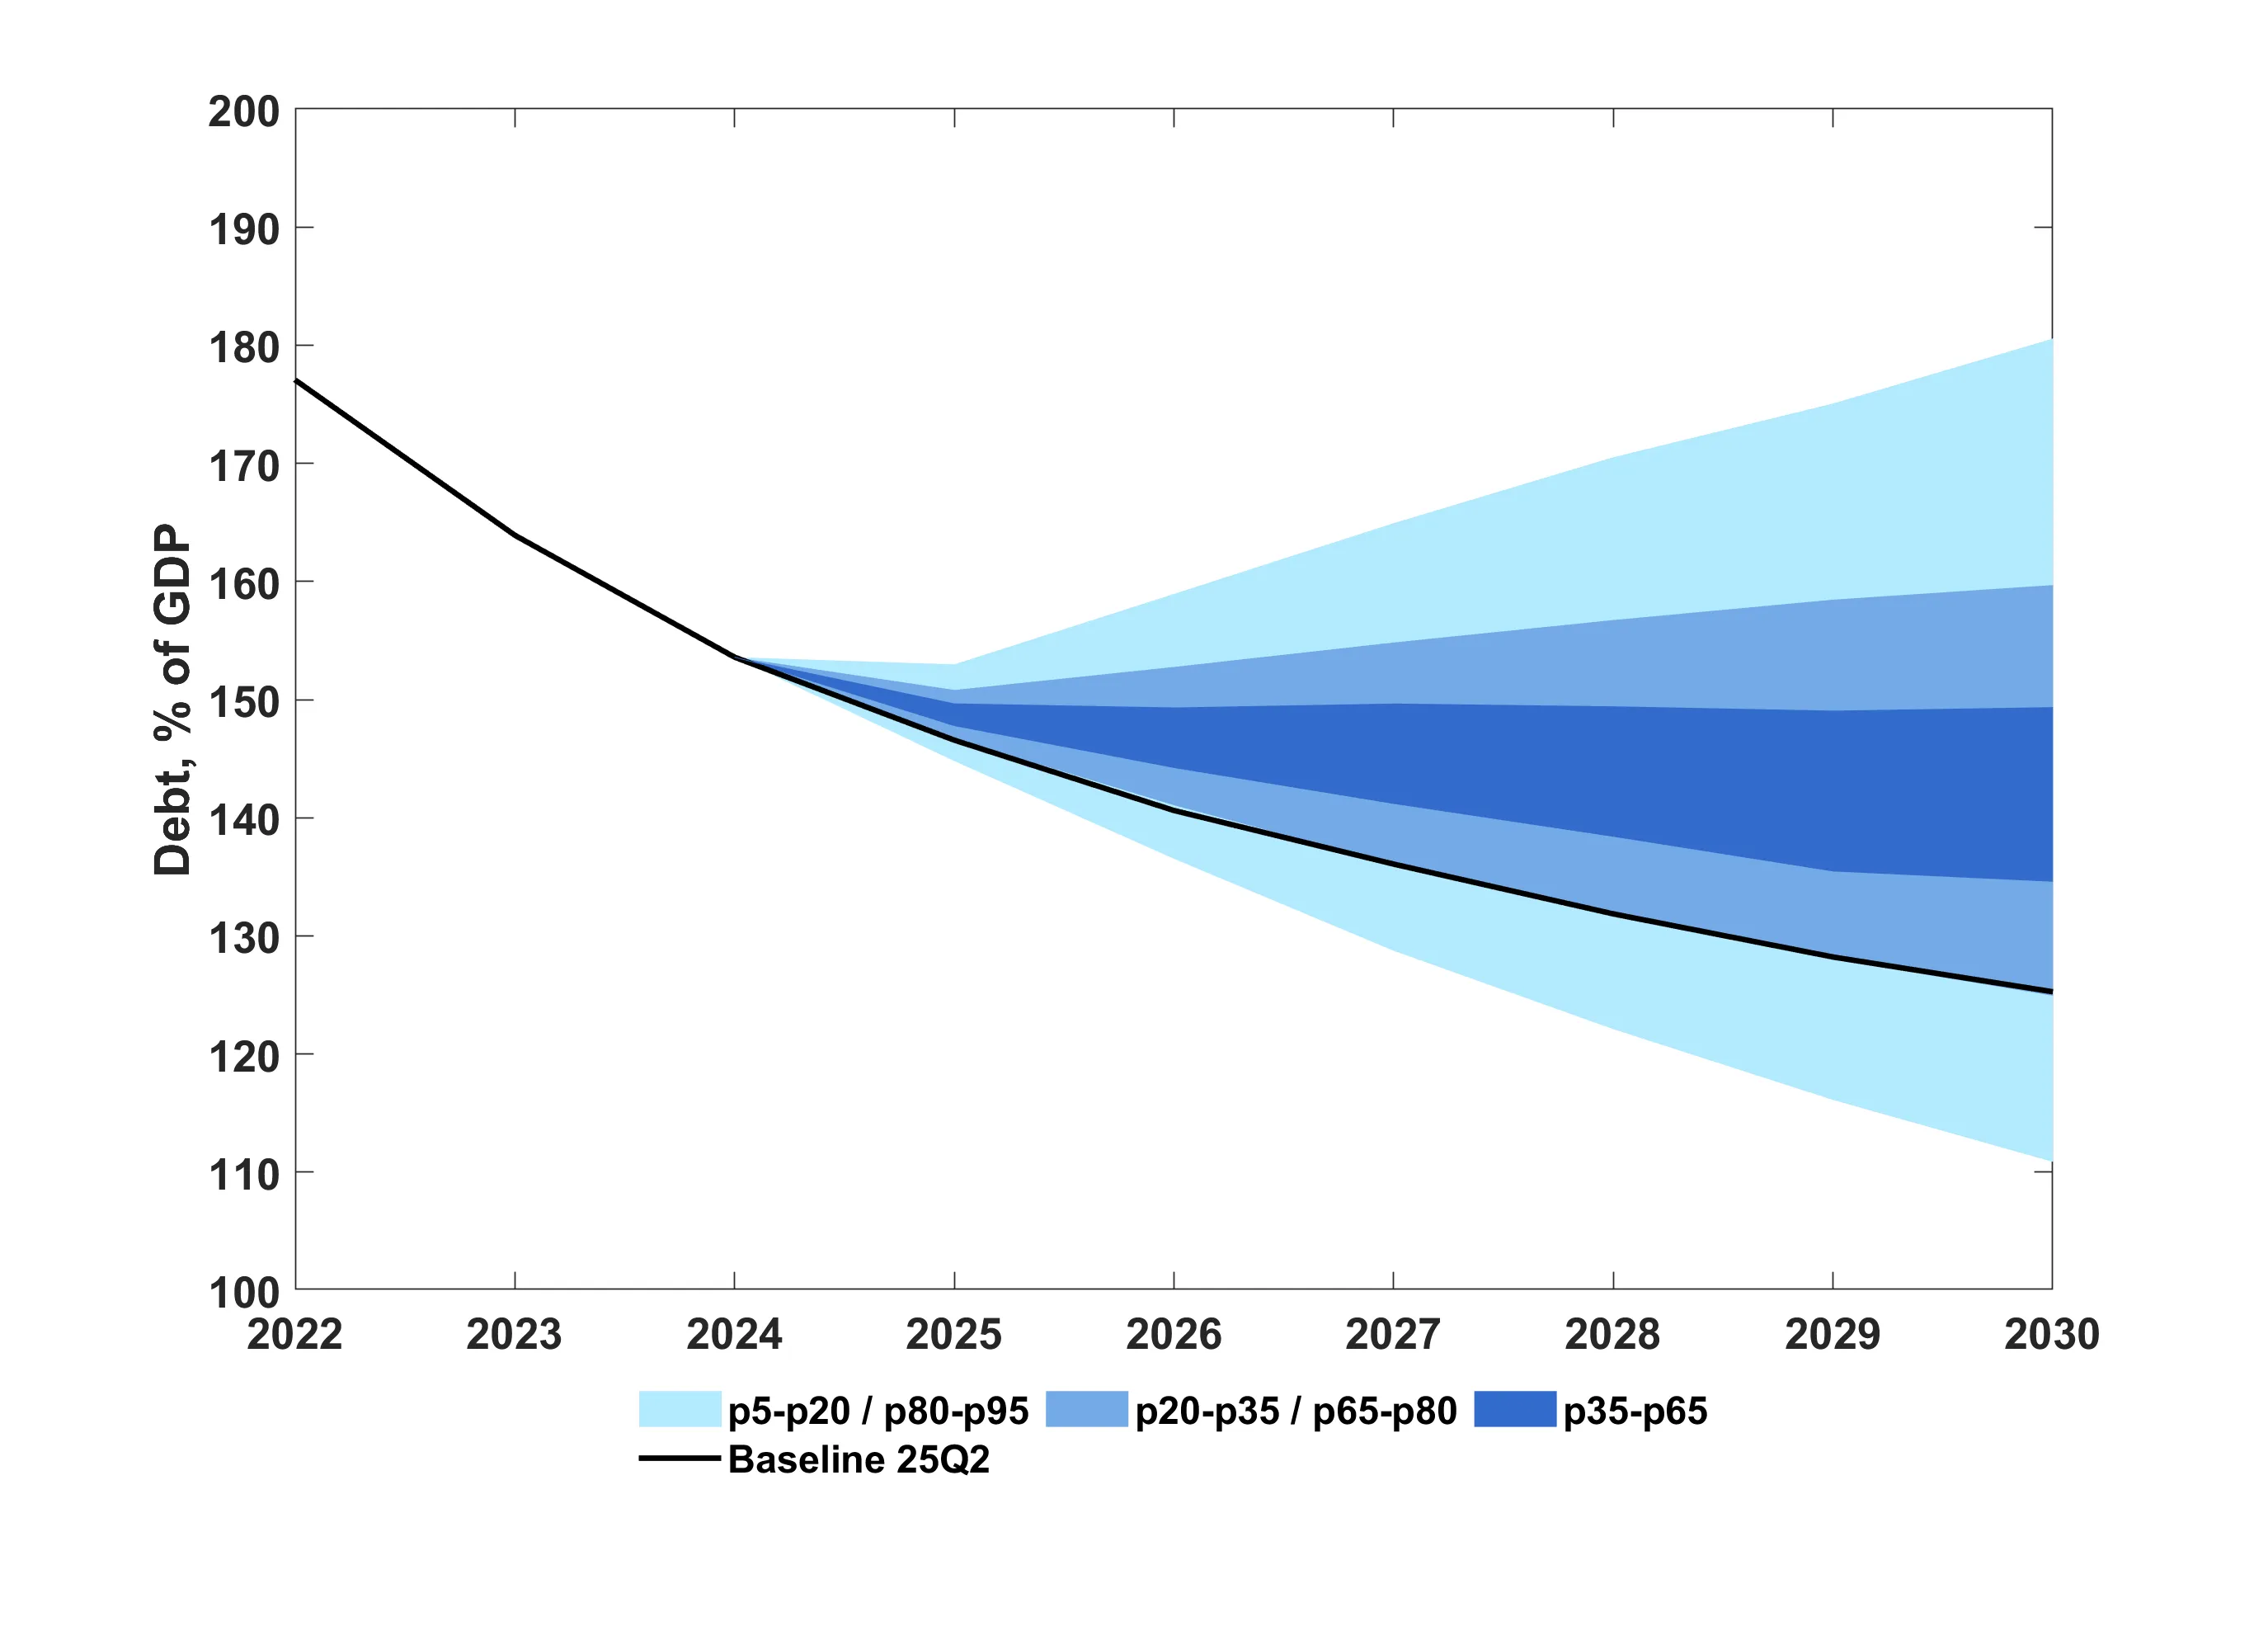
Figure 2
Debt fan chart for Greece. While the fan chart assigns a high probability to debt remaining on a downward path, it is nevertheless asymmetric, reflecting the elevated volatility and fiscal challenges observed during the crisis period.
Assessment
The ESM assesses a country’s risks to debt sustainability in the medium term, using information contained in the final “tilted” debt fan chart - constructed according to the methodology outlined in the previous sections - and accounting for a country’s economic size and institutional quality. The assessment is inspired by the medium-term module in the IMF’s Debt Sustainability Framework for market access countries, but it is adapted to reflect specific features of the euro area.
The ESM’s approach differs from that of the IMF along three main dimensions. First, the crisis definition used for the assessment is based on tail events in sovereign bond spreads, reflecting the near-absence of default episodes in the euro area. Second, the selected fan chart metrics differ: both fan chart asymmetry (measured by skewness) and country size (measured by GDP) have proven useful in increasing the model’s predictive power. Third, the inclusion of various predictors in a multivariate model allows us to more accurately capture policymakers' tolerance for either missed crises or false alarms.[8]
To see how well the debt fan chart can predict risks to debt sustainability over the medium term (three years ahead), the ESM built a historical database of fan charts starting from early 2011 for 18 euro area[9] countries. Each fan chart is produced by using only information available at the time, ensuring that the results mimic a real-time forecasting environment. Fan charts are aligned with the European Commission’s economic projections and long-term assumptions on debt and growth. Debt sustainability is judged according to the ESM’s definition of a crisis — a situation where a country faces serious difficulties borrowing on international markets. Following Zigraiova and Erce (2024), such periods are identified when a country’s 10-year bond spread over Germany rises above 350 basis points, signalling severe market stress.
The debt fan chart metrics identified as the best predictors of market access distress over the three-year horizon on the sample of euro area countries are:
- Probability of debt not stabilising – the likelihood that debt will not stabilise below current levels within 5 years.
- Width of the debt fan chart – measured as the gap between the most extreme 10% of possible results at both the lower and upper ends of the debt distribution five years ahead, capturing the degree of uncertainty around the baseline debt path.
- Interaction of skewness and projected debt-to-GDP – combining asymmetry in the projected debt distribution with the level of debt in five years, highlighting risks from both unfavourable shocks and high debt burdens.
- Interaction of GDP and institutional quality – reflecting sovereign vulnerability by accounting for economic size and debt-carrying capacity, proxied by the strength of institutions.
To assess the risk of a crisis over a three-year horizon, the information metrics extracted from the estimated tilted debt fan chart, along with measures of a country’s economic size and institutional quality, are combined into a single probability signal using a model that estimates the probability of an event occurring (Table A.1 in Annex).
This probability signal is then mapped into three risk zones using two thresholds: i) the lower threshold separating low from medium risk, and ii) the upper threshold separating medium from high risk. Thus, for any quarter, a country is classified as low, medium, or high risk depending on its estimated probability of market access distress relative to the two thresholds. Thresholds are set following the IMF’s approach in the medium-term module of the Debt Sustainability Framework for market access countries. They are calibrated on historical data to minimise misclassification: the lower threshold allows a missed crisis rate of up to 10%, while the upper threshold is chosen to keep the false alarm rate below 10%.[10]
Table 1 shows how well the country risk classification approach performs, expressed as the probability that a market distress event occurs given a signal in each risk zone. For instance, the probability of a crisis following a low-risk signal (Prob(S|L)) is just 2%, while the probability of a crisis following a high-risk signal (Prob(S|H)) is much higher, at 47%. In terms of overall accuracy, the model’s ability to correctly identify crisis events (sensitivity) is 67%, its ability to correctly identify non-crisis events (specificity) is 81%. Finally, the calibration of thresholds ensures that misclassification rates remain within the 10% limit. Specifically, the highest probability of distress associated with a low-risk signal (the boundary between low and medium risk) and the lowest probability of distress associated with a high-risk signal (the boundary between medium and high risk) are both around 10%.
Table 1
Performance of crisis risk classification in the three risk zones
| Prob (S/L) | Prob (N/L) | Prob (S/M) | Prob (N/M) | Prob (S/H) | Prob (N/H) | Missed crisis (L) | Missed crisis (M) | False alarms (H) |
|---|---|---|---|---|---|---|---|---|
| 0.02 | 0.98 | 0.23 | 0.77 | 0.47 | 0.53 | 0.10 | 0.22 | 0.10 |
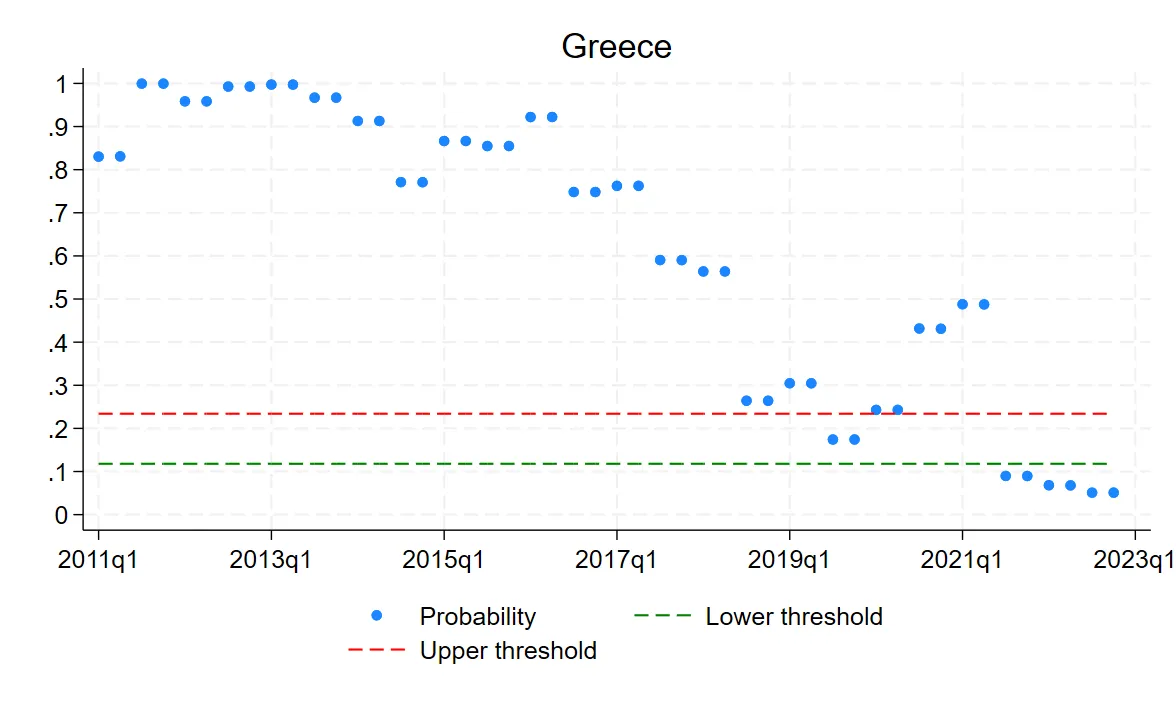
Applying the lower threshold of 11.8% and the upper threshold of 23.4% to the probability signal from the model classifies each country into one of three risk categories. Based on this mechanical signal, a country’s risk to debt sustainability can be tracked over time, as shown in Figure 3. However, the final assessment may differ from this purely mechanical approach, since expert judgment and additional factors - for example, adverse deterministic debt paths - are also taken into account.
Figure 3
Risk classification of Greece at different points in time given the market distress signal
Conclusions and policy implications
The ESM’s stochastic DSA methodology provides a structured and transparent way to assess the uncertainty surrounding debt dynamics by combining empirical regularities with country-specific expert judgment. The fan chart methodology not only highlights the range of plausible debt outcomes but also conveys information about the asymmetry of risks, offering early warning signals when baseline projections diverge from historical experience.
The accompanying assessment framework translates these signals into a classification of market access risks, calibrated to euro area historical data. The analysis shows that debt fan chart metrics — particularly the probability of debt stabilisation, the width and skewness of the distribution (i.e. how much the values lean to the upside or downside), and indicators of institutional strength — carry valuable information for predicting market access distress.
These features are combined into a single risk score using a statistical model, which allows countries to be classified as low, medium, or high risk. Historical testing confirms the robustness of the approach, with high sensitivity in detecting crisis episodes and recognising non-crisis periods.
Taken together, the methodology enhances the ESM’s capacity to detect vulnerabilities at an early stage, communicates risks in a clear and evidence-based manner, and ultimately supports its mandate of safeguarding financial stability in the euro area. Looking ahead, fan charts will remain a critical tool for assessing sovereign risk in the euro area. Their ability to capture uncertainty, quantify risks, and translate complex dynamics into actionable signals makes them an indispensable component of debt sustainability analysis.
Sources
Bouabdallah et al., 2017, “Debt sustainability analysis for euro area sovereigns: a methodological framework”. Occasional Paper Series No 185/April 2017
International Monetary Fund. Strategy, Policy, & Review Department. “Review of The Debt Sustainability Framework for Market Access Countries” Policy Papers 2021, 003 (2021).
Zigraiova, D. & Erce, A., 2024. “Quantifying risks to sovereign market access” IMF Economic Review, pp. 1-63.
Annex
Table A.1
Multivariate Probit Model Specification
| Regressors | Coefficients |
|---|---|
| Probability of debt not stabilizing in 5 years | 2.73*** (0.36) |
| Fan chart width (10th and 90th percentile) in 5 years | 0.01*** (0.00) |
| Skewness x Baseline debt in 5 years | 0.02*** (0.01) |
| GDP level x Institutional quality (inverse) | 0.00*** (0.00) |
| Constant | -3.37*** (0.30) |
| No. of observations | 760 |
Note: Standard errors in parentheses.
[1] A stochastic debt sustainability analysis accounts for uncertainty by simulating a wide range of potential future debt levels based on historical volatility and correlations of shocks to macroeconomic variables.
[2] Stock-flow adjustments refer to changes in the debt stock that are not directly explained by the primary deficit or the difference between interest rates and economic growth.
[3] A fan chart is a type of data visualisation for displaying both past observed data and forecasted future values along with their uncertainty. It combines a line graph for historical or observed data with shaded areas that show ranges of possible future outcomes. These shaded areas widen as the forecast goes further into the future to represent increasing uncertainty, creating a shape that resembles a fan (see for example Figure 1).
[4] International Monetary Fund (IMF). 2021. “Review of the Debt Sustainability Framework for Market Access Countries.” IMF Policy Paper, February 2021.
[5] Bayesian Vector Autoregression (BVAR) is a statistical modelling technique used in economics to analyse and forecast how interconnected variables evolve and influence each other over time. It enhances the standard Vector Autoregression model by incorporating Bayesian principles, which introduce prior knowledge or assumptions to better manage uncertainty.
[6] European Commission, “2024 Ageing Report. Economic and Budgetary Projections for the EU Member States (2022-2070)”.
[7] For instance, fiscal variables are projected after the end of the forecast horizon under the assumption of ‘no-policy change’
[8] A multivariate probability model is mathematical tool that describes the likelihood of different outcomes occurring together for multiple related variables at the same time.
[9] The sample does not include Croatia and Estonia due to data availability.
[10] Missed crisis rate (or type II error) is the probability of the model signalling low risk conditional on a stress episode (S) being realized, i.e. P(L|S). False alarm (or type I error) is the probability of the model signalling high risk conditional on a stress episode not being realized (NS), i.e. P(H|NS).
Authors


Manager ESM Briefs
